|
Download Data (XLS File) |
|
||||||||
|
||||||||
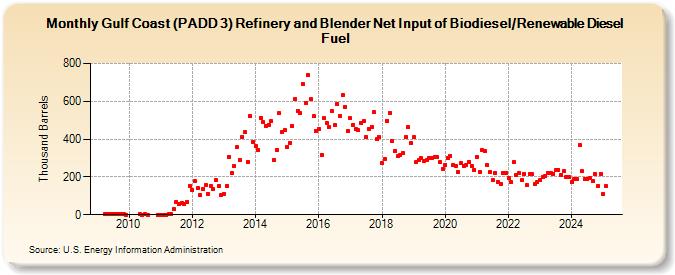
| Gulf Coast (PADD 3) Refinery and Blender Net Input of Biodiesel/Renewable Diesel Fuel (Thousand Barrels) | ||||||||
| Year | Jan | Feb | Mar | Apr | May | Jun | Jul | Aug | Sep | Oct | Nov | Dec |
|---|---|---|---|---|---|---|---|---|---|---|---|---|
| 2009 | 2 | 3 | 3 | 4 | 4 | 4 | 3 | 2 | 1 | |||
| 2010 | 2 | 1 | 2 | 1 | 1 | |||||||
| 2011 | 1 | 1 | 1 | 2 | 4 | 28 | 69 | 55 | 63 | 58 | 67 | 152 |
| 2012 | 132 | 178 | 141 | 106 | 135 | 157 | 110 | 154 | 134 | 181 | 153 | 104 |
| 2013 | 111 | 154 | 307 | 220 | 257 | 356 | 289 | 413 | 438 | 279 | 522 | 385 |
| 2014 | 366 | 343 | 514 | 489 | 471 | 476 | 494 | 291 | 343 | 536 | 438 | 447 |
| 2015 | 360 | 381 | 469 | 613 | 549 | 537 | 689 | 592 | 739 | 610 | 520 | 444 |
| 2016 | 454 | 316 | 509 | 486 | 463 | 546 | 473 | 584 | 520 | 633 | 572 | 443 |
| 2017 | 510 | 477 | 453 | 446 | 485 | 494 | 412 | 455 | 464 | 541 | 398 | 409 |
| 2018 | 273 | 293 | 497 | 540 | 391 | 339 | 308 | 318 | 324 | 411 | 462 | 380 |
| 2019 | 409 | 277 | 288 | 298 | 284 | 291 | 302 | 302 | 306 | 303 | 277 | 244 |
| 2020 | 264 | 301 | 312 | 263 | 260 | 227 | 271 | 258 | 261 | 280 | 257 | 238 |
| 2021 | 306 | 227 | 343 | 338 | 262 | 226 | 186 | 221 | 174 | 162 | 222 | 222 |
| 2022 | 194 | 173 | 280 | 210 | 220 | 182 | 216 | 155 | 217 | 213 | 163 | 172 |
| 2023 | 182 | 202 | 203 | 220 | 223 | 218 | 235 | 239 | 209 | 229 | 201 | 199 |
| 2024 | 174 | 190 | 188 | 370 | 229 | 191 | ||||||
| - = No Data Reported; -- = Not Applicable; NA = Not Available; W = Withheld to avoid disclosure of individual company data. |
| Release Date: 8/30/2024 |
| Next Release Date: 9/30/2024 |