|
Download Data (XLS File) |
|
||||||||
|
||||||||
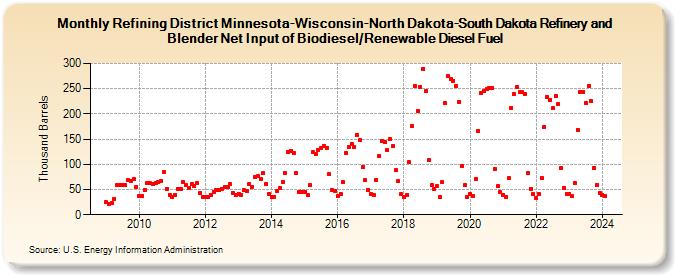
| Refining District Minnesota-Wisconsin-North Dakota-South Dakota Refinery and Blender Net Input of Biodiesel/Renewable Diesel Fuel (Thousand Barrels) | ||||||||
| Year | Jan | Feb | Mar | Apr | May | Jun | Jul | Aug | Sep | Oct | Nov | Dec |
|---|---|---|---|---|---|---|---|---|---|---|---|---|
| 2009 | 25 | 21 | 23 | 32 | 59 | 59 | 59 | 59 | 69 | 67 | 71 | 55 |
| 2010 | 37 | 37 | 50 | 63 | 62 | 60 | 63 | 65 | 66 | 84 | 52 | 40 |
| 2011 | 36 | 39 | 52 | 52 | 65 | 59 | 53 | 60 | 56 | 62 | 43 | 35 |
| 2012 | 36 | 35 | 40 | 46 | 50 | 50 | 52 | 55 | 55 | 60 | 44 | 39 |
| 2013 | 42 | 39 | 49 | 47 | 61 | 55 | 75 | 77 | 71 | 82 | 61 | 42 |
| 2014 | 35 | 36 | 47 | 53 | 64 | 83 | 125 | 127 | 123 | 82 | 45 | 46 |
| 2015 | 46 | 39 | 58 | 124 | 120 | 129 | 132 | 137 | 133 | 80 | 50 | 47 |
| 2016 | 37 | 42 | 64 | 123 | 135 | 141 | 134 | 159 | 148 | 94 | 68 | 50 |
| 2017 | 41 | 40 | 69 | 116 | 146 | 144 | 128 | 150 | 136 | 88 | 66 | 41 |
| 2018 | 36 | 39 | 104 | 176 | 255 | 206 | 254 | 290 | 245 | 108 | 58 | 51 |
| 2019 | 56 | 35 | 64 | 221 | 275 | 269 | 266 | 255 | 224 | 97 | 58 | 36 |
| 2020 | 42 | 37 | 71 | 167 | 241 | 245 | 249 | 252 | 251 | 91 | 56 | 45 |
| 2021 | 39 | 35 | 72 | 212 | 240 | 254 | 243 | 243 | 240 | 83 | 52 | 41 |
| 2022 | 34 | 41 | 73 | 174 | 233 | 228 | 211 | 235 | 220 | 92 | 53 | 41 |
| 2023 | 41 | 37 | 62 | 169 | 244 | 244 | 222 | 255 | 225 | 93 | 59 | 44 |
| 2024 | 39 | 38 | 74 | 208 | ||||||||
| - = No Data Reported; -- = Not Applicable; NA = Not Available; W = Withheld to avoid disclosure of individual company data. |
| Release Date: 6/28/2024 |
| Next Release Date: 7/31/2024 |