|
Download Data (XLS File) |
|
||||||||
|
||||||||
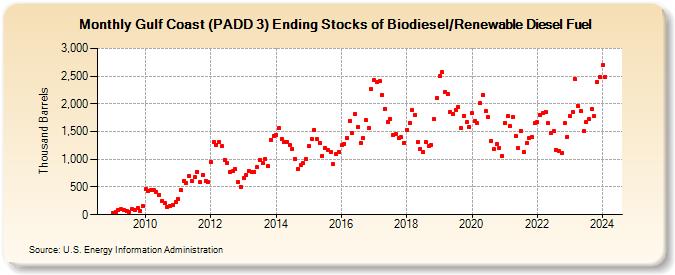
| Gulf Coast (PADD 3) Ending Stocks of Biodiesel/Renewable Diesel Fuel (Thousand Barrels) | ||||||||
| Year | Jan | Feb | Mar | Apr | May | Jun | Jul | Aug | Sep | Oct | Nov | Dec |
|---|---|---|---|---|---|---|---|---|---|---|---|---|
| 2009 | 34 | 51 | 90 | 96 | 83 | 72 | 54 | 101 | 88 | 123 | 62 | 152 |
| 2010 | 458 | 427 | 438 | 438 | 417 | 364 | 256 | 209 | 143 | 163 | 184 | 226 |
| 2011 | 286 | 440 | 614 | 572 | 698 | 600 | 673 | 778 | 584 | 721 | 605 | 585 |
| 2012 | 945 | 1,312 | 1,265 | 1,312 | 1,234 | 983 | 930 | 762 | 781 | 824 | 590 | 505 |
| 2013 | 659 | 717 | 796 | 769 | 774 | 855 | 985 | 931 | 1,009 | 873 | 1,355 | 1,422 |
| 2014 | 1,438 | 1,563 | 1,366 | 1,311 | 1,312 | 1,254 | 1,193 | 1,009 | 818 | 895 | 924 | 997 |
| 2015 | 1,231 | 1,366 | 1,535 | 1,360 | 1,299 | 1,066 | 1,209 | 1,171 | 1,132 | 908 | 1,102 | 1,135 |
| 2016 | 1,249 | 1,280 | 1,388 | 1,699 | 1,468 | 1,816 | 1,585 | 1,298 | 1,381 | 1,703 | 1,570 | 2,269 |
| 2017 | 2,429 | 2,398 | 2,411 | 2,161 | 1,913 | 1,680 | 1,729 | 1,439 | 1,447 | 1,380 | 1,395 | 1,302 |
| 2018 | 1,537 | 1,657 | 1,884 | 1,803 | 1,313 | 1,187 | 1,129 | 1,312 | 1,235 | 1,264 | 1,724 | 2,107 |
| 2019 | 2,497 | 2,569 | 2,215 | 2,184 | 1,850 | 1,822 | 1,894 | 1,942 | 1,572 | 1,787 | 1,673 | 1,585 |
| 2020 | 1,826 | 1,696 | 1,647 | 2,018 | 2,156 | 1,868 | 1,761 | 1,333 | 1,185 | 1,269 | 1,204 | 1,065 |
| 2021 | 1,657 | 1,777 | 1,597 | 1,761 | 1,423 | 1,197 | 1,518 | 1,128 | 1,289 | 1,375 | 1,399 | 1,649 |
| 2022 | 1,672 | 1,802 | 1,834 | 1,858 | 1,648 | 1,472 | 1,510 | 1,173 | 1,142 | 1,116 | 1,646 | 1,409 |
| 2023 | 1,784 | 1,858 | 2,440 | 1,968 | 1,875 | 1,504 | 1,668 | 1,718 | 1,901 | 1,773 | 2,394 | 2,487 |
| 2024 | 2,694 | |||||||||||
| - = No Data Reported; -- = Not Applicable; NA = Not Available; W = Withheld to avoid disclosure of individual company data. |
| Release Date: 3/29/2024 |
| Next Release Date: 4/30/2024 |