|
Download Data (XLS File) |
|
||||||||
|
||||||||
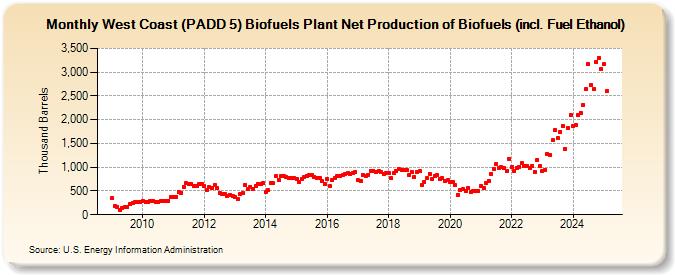
| West Coast (PADD 5) Biofuels Plant Net Production of Biofuels (incl. Fuel Ethanol) (Thousand Barrels) | ||||||||
| Year | Jan | Feb | Mar | Apr | May | Jun | Jul | Aug | Sep | Oct | Nov | Dec |
|---|---|---|---|---|---|---|---|---|---|---|---|---|
| 2009 | 344 | 185 | 169 | 108 | 147 | 171 | 163 | 227 | 237 | 262 | 259 | 277 |
| 2010 | 286 | 260 | 270 | 281 | 291 | 269 | 274 | 290 | 297 | 291 | 298 | 368 |
| 2011 | 364 | 382 | 473 | 465 | 589 | 659 | 655 | 653 | 611 | 607 | 640 | 648 |
| 2012 | 607 | 526 | 579 | 562 | 623 | 557 | 467 | 434 | 433 | 395 | 421 | 391 |
| 2013 | 367 | 324 | 429 | 452 | 622 | 531 | 587 | 546 | 607 | 655 | 644 | 657 |
| 2014 | 484 | 511 | 657 | 657 | 805 | 738 | 810 | 810 | 792 | 778 | 772 | 777 |
| 2015 | 754 | 678 | 753 | 785 | 816 | 832 | 829 | 797 | 769 | 774 | 703 | 646 |
| 2016 | 756 | 595 | 733 | 773 | 813 | 819 | 834 | 864 | 873 | 852 | 872 | 894 |
| 2017 | 721 | 717 | 832 | 818 | 843 | 926 | 927 | 900 | 927 | 900 | 855 | 870 |
| 2018 | 881 | 765 | 882 | 912 | 969 | 946 | 944 | 933 | 844 | 906 | 791 | 905 |
| 2019 | 924 | 634 | 692 | 767 | 865 | 762 | 817 | 831 | 759 | 765 | 701 | 723 |
| 2020 | 698 | 678 | 620 | 422 | 528 | 531 | 496 | 568 | 480 | 496 | 499 | 504 |
| 2021 | 609 | 564 | 663 | 705 | 865 | 969 | 1,068 | 990 | 1,001 | 974 | 914 | 1,179 |
| 2022 | 1,000 | 912 | 988 | 1,012 | 1,087 | 1,016 | 1,027 | 981 | 1,032 | 908 | 1,155 | 1,017 |
| 2023 | 917 | 946 | 1,276 | 1,263 | 1,566 | 1,781 | 1,606 | 1,747 | 1,871 | 1,305 | 1,763 | 2,009 |
| 2024 | 1,872 | |||||||||||
| - = No Data Reported; -- = Not Applicable; NA = Not Available; W = Withheld to avoid disclosure of individual company data. |
| Release Date: 3/29/2024 |
| Next Release Date: 4/30/2024 |