|
Download Data (XLS File) |
|
||||||||
|
||||||||
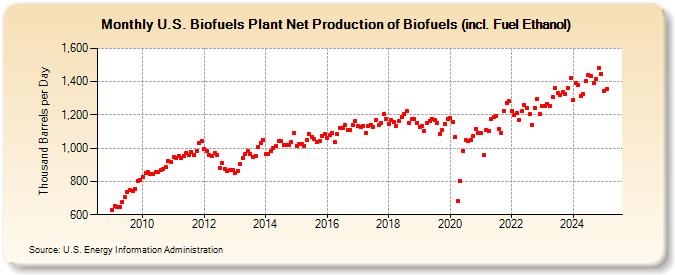
| U.S. Biofuels Plant Net Production of Biofuels (incl. Fuel Ethanol) (Thousand Barrels per Day) | ||||||||
| Year | Jan | Feb | Mar | Apr | May | Jun | Jul | Aug | Sep | Oct | Nov | Dec |
|---|---|---|---|---|---|---|---|---|---|---|---|---|
| 2009 | 631 | 652 | 649 | 646 | 678 | 704 | 738 | 746 | 741 | 757 | 804 | 811 |
| 2010 | 827 | 850 | 854 | 846 | 847 | 854 | 858 | 870 | 874 | 886 | 925 | 918 |
| 2011 | 945 | 938 | 955 | 941 | 953 | 972 | 959 | 976 | 962 | 985 | 1,029 | 1,043 |
| 2012 | 993 | 984 | 961 | 953 | 969 | 958 | 883 | 912 | 877 | 863 | 870 | 871 |
| 2013 | 852 | 863 | 904 | 938 | 963 | 981 | 968 | 947 | 953 | 1,009 | 1,033 | 1,052 |
| 2014 | 965 | 967 | 983 | 999 | 1,014 | 1,042 | 1,043 | 1,021 | 1,019 | 1,018 | 1,040 | 1,090 |
| 2015 | 1,016 | 1,024 | 1,026 | 1,016 | 1,047 | 1,086 | 1,069 | 1,055 | 1,035 | 1,046 | 1,073 | 1,086 |
| 2016 | 1,063 | 1,080 | 1,091 | 1,035 | 1,083 | 1,122 | 1,123 | 1,137 | 1,108 | 1,111 | 1,137 | 1,165 |
| 2017 | 1,132 | 1,127 | 1,134 | 1,089 | 1,132 | 1,138 | 1,127 | 1,169 | 1,140 | 1,152 | 1,205 | 1,176 |
| 2018 | 1,147 | 1,169 | 1,159 | 1,136 | 1,161 | 1,190 | 1,206 | 1,222 | 1,153 | 1,175 | 1,178 | 1,153 |
| 2019 | 1,130 | 1,132 | 1,104 | 1,153 | 1,166 | 1,176 | 1,172 | 1,149 | 1,087 | 1,109 | 1,146 | 1,175 |
| 2020 | 1,179 | 1,160 | 1,065 | 681 | 800 | 985 | 1,050 | 1,042 | 1,052 | 1,076 | 1,118 | 1,093 |
| 2021 | 1,089 | 961 | 1,111 | 1,102 | 1,176 | 1,187 | 1,194 | 1,116 | 1,094 | 1,225 | 1,274 | 1,283 |
| 2022 | 1,225 | 1,201 | 1,213 | 1,171 | 1,221 | 1,262 | 1,242 | 1,204 | 1,139 | 1,241 | 1,298 | 1,208 |
| 2023 | 1,258 | 1,257 | 1,271 | 1,254 | 1,312 | 1,363 | 1,329 | 1,320 | 1,343 | 1,326 | 1,358 | 1,418 |
| 2024 | 1,289 | |||||||||||
| - = No Data Reported; -- = Not Applicable; NA = Not Available; W = Withheld to avoid disclosure of individual company data. |
| Release Date: 3/29/2024 |
| Next Release Date: 4/30/2024 |