|
Download Data (XLS File) |
|
||||||||
|
||||||||
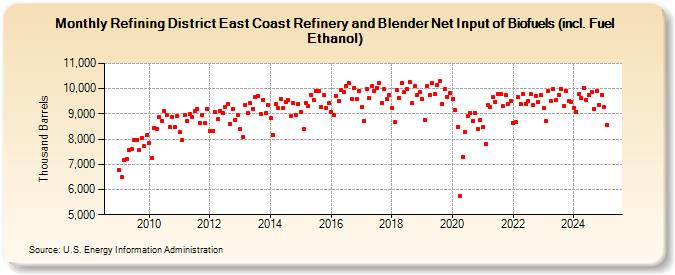
| Refining District East Coast Refinery and Blender Net Input of Biofuels (incl. Fuel Ethanol) (Thousand Barrels) | ||||||||
| Year | Jan | Feb | Mar | Apr | May | Jun | Jul | Aug | Sep | Oct | Nov | Dec |
|---|---|---|---|---|---|---|---|---|---|---|---|---|
| 2009 | 6,786 | 6,495 | 7,160 | 7,216 | 7,576 | 7,603 | 7,957 | 7,965 | 7,561 | 8,061 | 7,715 | 8,149 |
| 2010 | 7,863 | 7,251 | 8,451 | 8,403 | 8,892 | 8,705 | 9,108 | 8,974 | 8,499 | 8,882 | 8,490 | 8,924 |
| 2011 | 8,265 | 7,949 | 8,952 | 8,716 | 8,988 | 8,887 | 9,119 | 9,209 | 8,648 | 8,949 | 8,636 | 9,192 |
| 2012 | 8,334 | 8,324 | 9,087 | 8,787 | 9,130 | 9,028 | 9,292 | 9,393 | 8,613 | 9,210 | 8,763 | 8,970 |
| 2013 | 8,420 | 8,093 | 9,350 | 9,038 | 9,440 | 9,187 | 9,654 | 9,707 | 8,990 | 9,561 | 9,021 | 9,372 |
| 2014 | 8,818 | 8,161 | 9,376 | 9,232 | 9,601 | 9,232 | 9,452 | 9,539 | 8,934 | 9,445 | 8,949 | 9,391 |
| 2015 | 9,089 | 8,385 | 9,440 | 9,322 | 9,761 | 9,534 | 9,908 | 9,893 | 9,269 | 9,756 | 9,250 | 9,415 |
| 2016 | 9,077 | 8,943 | 9,729 | 9,520 | 9,934 | 9,882 | 10,106 | 10,230 | 9,595 | 10,021 | 9,590 | 9,896 |
| 2017 | 9,256 | 8,727 | 10,005 | 9,611 | 10,106 | 9,889 | 10,012 | 10,236 | 9,435 | 9,975 | 9,600 | 9,755 |
| 2018 | 9,230 | 8,662 | 9,963 | 9,620 | 10,221 | 9,864 | 9,996 | 10,254 | 9,438 | 10,097 | 9,758 | 9,850 |
| 2019 | 9,578 | 8,751 | 10,096 | 9,743 | 10,229 | 9,780 | 10,130 | 10,324 | 9,384 | 9,973 | 9,684 | 9,813 |
| 2020 | 9,603 | 9,143 | 8,479 | 5,723 | 7,293 | 8,290 | 8,908 | 9,051 | 8,713 | 9,046 | 8,420 | 8,742 |
| 2021 | 8,498 | 7,792 | 9,348 | 9,261 | 9,669 | 9,481 | 9,796 | 9,806 | 9,299 | 9,730 | 9,397 | 9,510 |
| 2022 | 8,626 | 8,690 | 9,652 | 9,389 | 9,775 | 9,407 | 9,512 | 9,807 | 9,342 | 9,695 | 9,459 | 9,740 |
| 2023 | 9,203 | 8,713 | 9,924 | 9,527 | 9,985 | 9,543 | 9,764 | 9,992 | 9,313 | 9,899 | 9,528 | 9,480 |
| 2024 | 9,252 | 9,070 | 9,786 | 9,627 | ||||||||
| - = No Data Reported; -- = Not Applicable; NA = Not Available; W = Withheld to avoid disclosure of individual company data. |
| Release Date: 6/28/2024 |
| Next Release Date: 7/31/2024 |