|
Download Data (XLS File) |
|
||||||||
|
||||||||
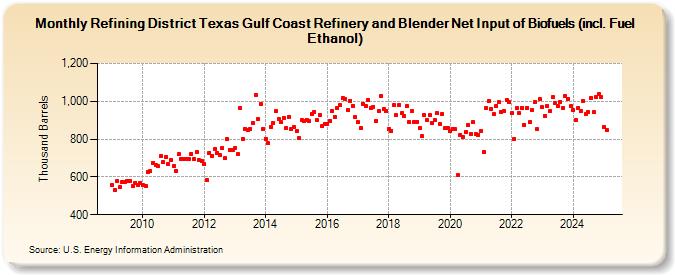
| Refining District Texas Gulf Coast Refinery and Blender Net Input of Biofuels (incl. Fuel Ethanol) (Thousand Barrels) | ||||||||
| Year | Jan | Feb | Mar | Apr | May | Jun | Jul | Aug | Sep | Oct | Nov | Dec |
|---|---|---|---|---|---|---|---|---|---|---|---|---|
| 2009 | 556 | 530 | 580 | 544 | 573 | 573 | 577 | 580 | 550 | 570 | 558 | 570 |
| 2010 | 556 | 554 | 626 | 629 | 676 | 661 | 656 | 708 | 677 | 707 | 666 | 690 |
| 2011 | 658 | 631 | 719 | 697 | 697 | 694 | 694 | 722 | 694 | 731 | 689 | 686 |
| 2012 | 666 | 582 | 729 | 713 | 746 | 727 | 714 | 753 | 698 | 800 | 743 | 742 |
| 2013 | 754 | 719 | 964 | 803 | 855 | 850 | 855 | 886 | 1,033 | 904 | 985 | 853 |
| 2014 | 803 | 778 | 866 | 885 | 946 | 904 | 889 | 913 | 858 | 919 | 852 | 864 |
| 2015 | 841 | 804 | 901 | 896 | 903 | 897 | 934 | 945 | 901 | 928 | 870 | 880 |
| 2016 | 879 | 898 | 949 | 917 | 965 | 978 | 1,017 | 1,011 | 954 | 1,004 | 977 | 915 |
| 2017 | 889 | 858 | 986 | 975 | 1,007 | 963 | 972 | 898 | 949 | 1,027 | 959 | 949 |
| 2018 | 856 | 843 | 979 | 926 | 982 | 938 | 921 | 975 | 891 | 948 | 889 | 893 |
| 2019 | 858 | 814 | 926 | 900 | 926 | 886 | 902 | 936 | 881 | 934 | 860 | 858 |
| 2020 | 842 | 854 | 851 | 608 | 822 | 810 | 838 | 874 | 828 | 889 | 825 | 822 |
| 2021 | 844 | 733 | 963 | 999 | 959 | 931 | 976 | 994 | 941 | 946 | 1,006 | 995 |
| 2022 | 936 | 803 | 965 | 937 | 967 | 876 | 967 | 888 | 954 | 997 | 852 | 1,010 |
| 2023 | 948 | 913 | 1,030 | 930 | 995 | 996 | 972 | 954 | 978 | 1,004 | 993 | 981 |
| 2024 | 952 | |||||||||||
| - = No Data Reported; -- = Not Applicable; NA = Not Available; W = Withheld to avoid disclosure of individual company data. |
| Release Date: 3/29/2024 |
| Next Release Date: 4/30/2024 |