|
Download Data (XLS File) |
|
||||||||
|
||||||||
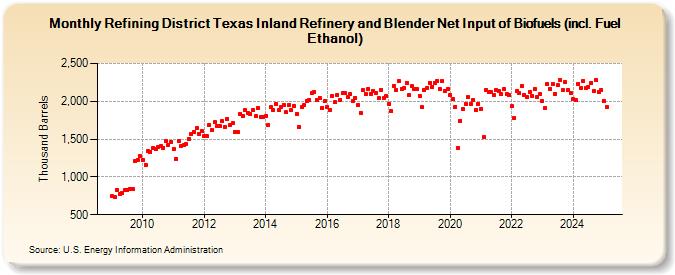
| Refining District Texas Inland Refinery and Blender Net Input of Biofuels (incl. Fuel Ethanol) (Thousand Barrels) | ||||||||
| Year | Jan | Feb | Mar | Apr | May | Jun | Jul | Aug | Sep | Oct | Nov | Dec |
|---|---|---|---|---|---|---|---|---|---|---|---|---|
| 2009 | 741 | 740 | 825 | 778 | 784 | 826 | 827 | 842 | 838 | 1,213 | 1,228 | 1,274 |
| 2010 | 1,229 | 1,162 | 1,342 | 1,334 | 1,378 | 1,363 | 1,391 | 1,405 | 1,388 | 1,471 | 1,426 | 1,467 |
| 2011 | 1,365 | 1,242 | 1,470 | 1,415 | 1,425 | 1,434 | 1,505 | 1,564 | 1,594 | 1,645 | 1,574 | 1,608 |
| 2012 | 1,540 | 1,537 | 1,683 | 1,622 | 1,722 | 1,679 | 1,674 | 1,736 | 1,664 | 1,772 | 1,689 | 1,707 |
| 2013 | 1,589 | 1,593 | 1,834 | 1,804 | 1,882 | 1,849 | 1,834 | 1,889 | 1,802 | 1,908 | 1,787 | 1,788 |
| 2014 | 1,804 | 1,687 | 1,919 | 1,881 | 1,965 | 1,886 | 1,922 | 1,951 | 1,855 | 1,955 | 1,879 | 1,942 |
| 2015 | 1,833 | 1,660 | 1,921 | 1,946 | 2,010 | 2,016 | 2,109 | 2,117 | 2,016 | 2,049 | 1,915 | 1,998 |
| 2016 | 1,926 | 1,889 | 2,067 | 1,986 | 2,080 | 2,023 | 2,110 | 2,104 | 2,055 | 2,091 | 2,004 | 2,044 |
| 2017 | 1,956 | 1,850 | 2,147 | 2,090 | 2,168 | 2,103 | 2,130 | 2,112 | 2,040 | 2,152 | 2,038 | 2,065 |
| 2018 | 1,961 | 1,871 | 2,206 | 2,143 | 2,268 | 2,166 | 2,176 | 2,242 | 2,083 | 2,202 | 2,162 | 2,157 |
| 2019 | 2,076 | 1,920 | 2,155 | 2,181 | 2,248 | 2,195 | 2,242 | 2,269 | 2,156 | 2,266 | 2,139 | 2,158 |
| 2020 | 2,086 | 2,030 | 1,931 | 1,386 | 1,744 | 1,893 | 1,966 | 2,054 | 1,960 | 2,016 | 1,889 | 1,968 |
| 2021 | 1,904 | 1,530 | 2,152 | 2,119 | 2,121 | 2,087 | 2,144 | 2,136 | 2,096 | 2,165 | 2,095 | 2,086 |
| 2022 | 1,935 | 1,779 | 2,132 | 2,108 | 2,202 | 2,082 | 2,055 | 2,123 | 2,075 | 2,164 | 2,060 | 2,092 |
| 2023 | 2,003 | 1,901 | 2,227 | 2,171 | 2,227 | 2,109 | 2,209 | 2,276 | 2,154 | 2,253 | 2,127 | 2,101 |
| 2024 | 2,029 | |||||||||||
| - = No Data Reported; -- = Not Applicable; NA = Not Available; W = Withheld to avoid disclosure of individual company data. |
| Release Date: 3/29/2024 |
| Next Release Date: 4/30/2024 |