|
Download Data (XLS File) |
|
||||||||
|
||||||||
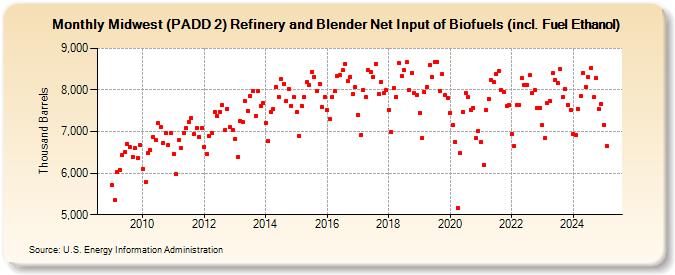
| Midwest (PADD 2) Refinery and Blender Net Input of Biofuels (incl. Fuel Ethanol) (Thousand Barrels) | ||||||||
| Year | Jan | Feb | Mar | Apr | May | Jun | Jul | Aug | Sep | Oct | Nov | Dec |
|---|---|---|---|---|---|---|---|---|---|---|---|---|
| 2009 | 5,713 | 5,345 | 6,016 | 6,086 | 6,443 | 6,509 | 6,695 | 6,620 | 6,394 | 6,596 | 6,362 | 6,665 |
| 2010 | 6,103 | 5,791 | 6,494 | 6,561 | 6,866 | 6,803 | 7,194 | 7,108 | 6,735 | 6,958 | 6,675 | 6,962 |
| 2011 | 6,467 | 5,973 | 6,793 | 6,614 | 6,963 | 7,081 | 7,220 | 7,321 | 6,933 | 7,076 | 6,871 | 7,074 |
| 2012 | 6,625 | 6,459 | 6,886 | 6,962 | 7,474 | 7,373 | 7,479 | 7,629 | 7,029 | 7,551 | 7,106 | 7,034 |
| 2013 | 6,830 | 6,393 | 7,256 | 7,222 | 7,725 | 7,502 | 7,857 | 7,976 | 7,386 | 7,971 | 7,626 | 7,676 |
| 2014 | 7,201 | 6,778 | 7,460 | 7,542 | 8,075 | 7,836 | 8,261 | 8,148 | 7,729 | 8,025 | 7,621 | 7,827 |
| 2015 | 7,462 | 6,893 | 7,624 | 7,832 | 8,188 | 8,118 | 8,439 | 8,311 | 7,969 | 8,143 | 7,592 | 7,826 |
| 2016 | 7,517 | 7,295 | 7,833 | 7,965 | 8,328 | 8,358 | 8,472 | 8,626 | 8,205 | 8,306 | 7,908 | 8,064 |
| 2017 | 7,406 | 6,911 | 8,008 | 7,823 | 8,481 | 8,435 | 8,311 | 8,628 | 7,907 | 8,194 | 7,937 | 7,999 |
| 2018 | 7,527 | 6,986 | 8,043 | 7,836 | 8,660 | 8,330 | 8,482 | 8,670 | 7,995 | 8,419 | 7,919 | 7,884 |
| 2019 | 7,455 | 6,854 | 7,953 | 8,065 | 8,593 | 8,321 | 8,666 | 8,676 | 7,979 | 8,373 | 7,868 | 7,813 |
| 2020 | 7,456 | 7,163 | 6,760 | 5,168 | 6,488 | 7,471 | 7,926 | 7,823 | 7,529 | 7,573 | 6,833 | 7,007 |
| 2021 | 6,747 | 6,204 | 7,517 | 7,784 | 8,248 | 8,202 | 8,389 | 8,449 | 7,996 | 7,948 | 7,613 | 7,631 |
| 2022 | 6,933 | 6,655 | 7,638 | 7,643 | 8,286 | 8,125 | 8,125 | 8,352 | 7,931 | 7,997 | 7,572 | 7,566 |
| 2023 | 7,153 | 6,845 | 7,697 | 7,725 | 8,401 | 8,245 | 8,164 | 8,507 | 7,842 | 8,015 | 7,635 | 7,514 |
| 2024 | 6,948 | |||||||||||
| - = No Data Reported; -- = Not Applicable; NA = Not Available; W = Withheld to avoid disclosure of individual company data. |
| Release Date: 3/29/2024 |
| Next Release Date: 4/30/2024 |