|
Download Data (XLS File) |
|
||||||||
|
||||||||
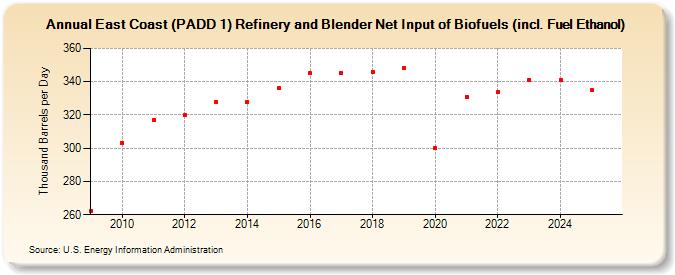
| East Coast (PADD 1) Refinery and Blender Net Input of Biofuels (incl. Fuel Ethanol) (Thousand Barrels per Day) | ||||||||
| Decade | Year-0 | Year-1 | Year-2 | Year-3 | Year-4 | Year-5 | Year-6 | Year-7 | Year-8 | Year-9 |
|---|---|---|---|---|---|---|---|---|---|---|
| 2000's | 262 | |||||||||
| 2010's | 303 | 317 | 320 | 328 | 328 | 336 | 345 | 345 | 346 | 348 |
| 2020's | 300 | 331 | 334 | 341 |
| - = No Data Reported; -- = Not Applicable; NA = Not Available; W = Withheld to avoid disclosure of individual company data. |
| Release Date: 3/29/2024 |
| Next Release Date: 8/30/2024 |