|
Download Data (XLS File) |
|
||||||||
|
||||||||
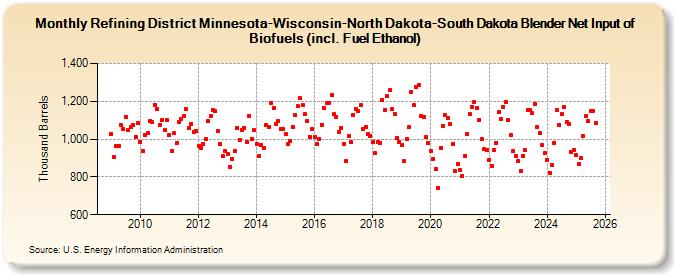
| Refining District Minnesota-Wisconsin-North Dakota-South Dakota Blender Net Input of Biofuels (incl. Fuel Ethanol) (Thousand Barrels) | ||||||||
| Year | Jan | Feb | Mar | Apr | May | Jun | Jul | Aug | Sep | Oct | Nov | Dec |
|---|---|---|---|---|---|---|---|---|---|---|---|---|
| 2009 | 1,027 | 905 | 962 | 966 | 1,075 | 1,053 | 1,118 | 1,050 | 1,065 | 1,073 | 1,012 | 1,085 |
| 2010 | 986 | 937 | 1,022 | 1,031 | 1,095 | 1,089 | 1,182 | 1,158 | 1,076 | 1,099 | 1,048 | 1,100 |
| 2011 | 1,021 | 939 | 1,032 | 980 | 1,092 | 1,104 | 1,124 | 1,158 | 1,058 | 1,078 | 1,040 | 1,042 |
| 2012 | 963 | 951 | 975 | 999 | 1,096 | 1,122 | 1,154 | 1,146 | 1,043 | 973 | 909 | 937 |
| 2013 | 920 | 854 | 896 | 935 | 1,059 | 996 | 1,050 | 1,057 | 986 | 1,121 | 1,000 | 1,046 |
| 2014 | 975 | 913 | 969 | 953 | 1,074 | 1,064 | 1,191 | 1,167 | 1,081 | 1,096 | 1,051 | 1,051 |
| 2015 | 1,026 | 976 | 990 | 1,065 | 1,130 | 1,175 | 1,215 | 1,179 | 1,132 | 1,097 | 1,011 | 1,051 |
| 2016 | 1,012 | 975 | 1,002 | 1,076 | 1,163 | 1,190 | 1,190 | 1,231 | 1,131 | 1,117 | 1,038 | 1,060 |
| 2017 | 975 | 884 | 1,015 | 983 | 1,130 | 1,157 | 1,149 | 1,178 | 1,055 | 1,064 | 1,027 | 1,019 |
| 2018 | 983 | 924 | 986 | 979 | 1,208 | 1,156 | 1,227 | 1,260 | 1,157 | 1,134 | 1,007 | 986 |
| 2019 | 970 | 883 | 1,003 | 1,062 | 1,250 | 1,180 | 1,277 | 1,284 | 1,122 | 1,117 | 1,009 | 977 |
| 2020 | 939 | 897 | 843 | 740 | 953 | 1,067 | 1,129 | 1,110 | 1,079 | 973 | 829 | 867 |
| 2021 | 837 | 807 | 910 | 1,026 | 1,135 | 1,172 | 1,196 | 1,166 | 1,103 | 998 | 945 | 941 |
| 2022 | 891 | 860 | 940 | 981 | 1,142 | 1,107 | 1,172 | 1,198 | 1,101 | 1,021 | 937 | 910 |
| 2023 | 884 | 830 | 913 | 940 | 1,152 | 1,152 | 1,136 | 1,187 | 1,063 | 1,033 | 969 | 925 |
| 2024 | 891 | |||||||||||
| - = No Data Reported; -- = Not Applicable; NA = Not Available; W = Withheld to avoid disclosure of individual company data. |
| Release Date: 3/29/2024 |
| Next Release Date: 4/30/2024 |