|
Download Data (XLS File) |
|
||||||||
|
||||||||
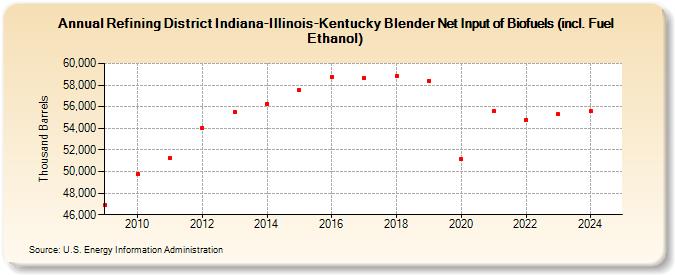
| Refining District Indiana-Illinois-Kentucky Blender Net Input of Biofuels (incl. Fuel Ethanol) (Thousand Barrels) | ||||||||
| Decade | Year-0 | Year-1 | Year-2 | Year-3 | Year-4 | Year-5 | Year-6 | Year-7 | Year-8 | Year-9 |
|---|---|---|---|---|---|---|---|---|---|---|
| 2000's | 46,893 | |||||||||
| 2010's | 49,758 | 51,266 | 54,028 | 55,552 | 56,264 | 57,539 | 58,755 | 58,662 | 58,859 | 58,415 |
| 2020's | 51,116 | 55,581 | 54,780 | 55,295 |
| - = No Data Reported; -- = Not Applicable; NA = Not Available; W = Withheld to avoid disclosure of individual company data. |
| Release Date: 3/29/2024 |
| Next Release Date: 8/30/2024 |