|
Download Data (XLS File) |
|
||||||||
|
||||||||
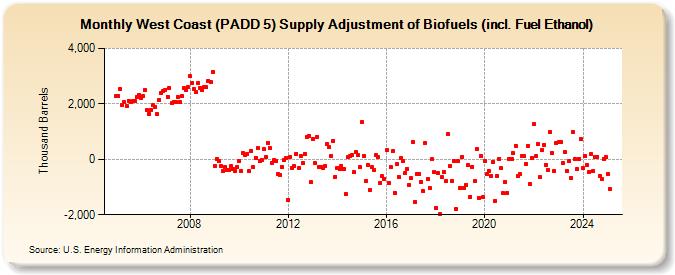
| West Coast (PADD 5) Supply Adjustment of Biofuels (incl. Fuel Ethanol) (Thousand Barrels) | ||||||||
| Year | Jan | Feb | Mar | Apr | May | Jun | Jul | Aug | Sep | Oct | Nov | Dec |
|---|---|---|---|---|---|---|---|---|---|---|---|---|
| 2005 | 2,265 | 2,290 | 2,533 | 1,940 | 2,053 | 1,921 | 2,116 | 2,053 | 2,093 | 2,099 | 2,263 | 2,319 |
| 2006 | 2,214 | 2,271 | 2,502 | 1,793 | 1,650 | 1,795 | 1,943 | 1,893 | 1,618 | 2,144 | 2,376 | 2,449 |
| 2007 | 2,501 | 2,258 | 2,572 | 2,020 | 2,051 | 2,054 | 2,257 | 2,063 | 2,278 | 2,555 | 2,511 | 2,595 |
| 2008 | 2,990 | 2,750 | 2,538 | 2,426 | 2,749 | 2,564 | 2,512 | 2,603 | 2,597 | 2,832 | 2,797 | 3,155 |
| 2009 | -231 | 22 | -78 | -230 | -421 | -272 | -394 | -389 | -250 | -334 | -420 | -284 |
| 2010 | -78 | -436 | 209 | 153 | 203 | -435 | 305 | -292 | 60 | 407 | -65 | -17 |
| 2011 | 366 | 74 | 596 | 409 | -127 | -34 | -54 | -530 | -558 | -271 | -34 | 47 |
| 2012 | -1,456 | 75 | -298 | -245 | 207 | -329 | 131 | -120 | 197 | 811 | 855 | -836 |
| 2013 | 737 | -140 | 820 | -266 | -266 | -311 | -239 | 555 | 433 | 114 | 672 | -629 |
| 2014 | -309 | -357 | -239 | -348 | -1,249 | 76 | 105 | 139 | -469 | 259 | 151 | -291 |
| 2015 | 1,344 | 118 | -789 | -201 | -1,096 | -292 | -394 | 154 | 89 | -850 | -616 | -702 |
| 2016 | 323 | -854 | -282 | 296 | -1,206 | -172 | -622 | 34 | -80 | -488 | -336 | -913 |
| 2017 | -691 | 614 | -1,529 | -517 | -529 | -818 | -1,162 | 580 | -696 | -1,036 | -1 | -466 |
| 2018 | -1,746 | -493 | -1,978 | -642 | -465 | -790 | 901 | -249 | -776 | -67 | -1,799 | -79 |
| 2019 | -1,024 | 86 | -1,023 | -912 | -221 | -1,343 | -275 | -798 | 366 | -1,396 | 133 | -1,377 |
| 2020 | -48 | -542 | -421 | -610 | -100 | -1,502 | -600 | 26 | -316 | -1,231 | -820 | -1,213 |
| 2021 | 13 | 26 | 209 | 495 | -602 | -537 | 126 | 115 | -154 | 491 | -888 | 38 |
| 2022 | 1,256 | 104 | 542 | -641 | 320 | 530 | -195 | -390 | 982 | 220 | -422 | 577 |
| 2023 | 583 | 623 | -122 | 254 | -428 | -50 | -653 | 938 | -20 | -318 | 4 | 711 |
| 2024 | -331 | 103 | -215 | -456 | ||||||||
| - = No Data Reported; -- = Not Applicable; NA = Not Available; W = Withheld to avoid disclosure of individual company data. |
| Release Date: 6/28/2024 |
| Next Release Date: 7/31/2024 |