|
Download Data (XLS File) |
|
||||||||
|
||||||||
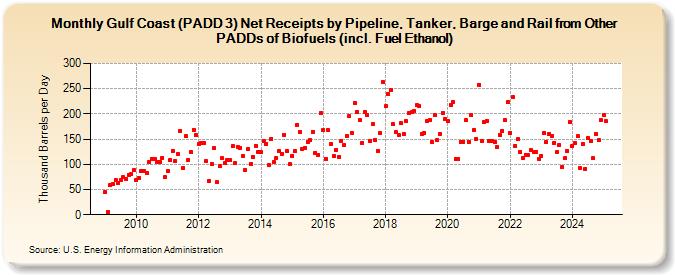
| Gulf Coast (PADD 3) Net Receipts by Pipeline, Tanker, Barge and Rail from Other PADDs of Biofuels (incl. Fuel Ethanol) (Thousand Barrels per Day) | ||||||||
| Year | Jan | Feb | Mar | Apr | May | Jun | Jul | Aug | Sep | Oct | Nov | Dec |
|---|---|---|---|---|---|---|---|---|---|---|---|---|
| 2009 | 45 | 6 | 58 | 61 | 68 | 63 | 69 | 74 | 71 | 79 | 81 | 88 |
| 2010 | 69 | 73 | 86 | 87 | 83 | 105 | 111 | 111 | 104 | 105 | 113 | 74 |
| 2011 | 86 | 109 | 127 | 107 | 121 | 167 | 93 | 156 | 109 | 124 | 169 | 158 |
| 2012 | 140 | 142 | 143 | 106 | 67 | 101 | 132 | 64 | 96 | 112 | 103 | 109 |
| 2013 | 108 | 136 | 102 | 135 | 133 | 117 | 89 | 130 | 101 | 115 | 137 | 124 |
| 2014 | 124 | 146 | 141 | 98 | 151 | 105 | 113 | 126 | 121 | 159 | 126 | 100 |
| 2015 | 117 | 126 | 178 | 165 | 131 | 133 | 144 | 148 | 165 | 123 | 119 | 202 |
| 2016 | 168 | 111 | 168 | 140 | 116 | 129 | 115 | 147 | 138 | 156 | 195 | 163 |
| 2017 | 222 | 204 | 187 | 143 | 203 | 198 | 146 | 179 | 149 | 127 | 162 | 263 |
| 2018 | 215 | 239 | 247 | 179 | 164 | 159 | 181 | 160 | 185 | 202 | 203 | 206 |
| 2019 | 217 | 216 | 161 | 163 | 185 | 187 | 144 | 197 | 148 | 161 | 202 | 190 |
| 2020 | 186 | 218 | 224 | 111 | 111 | 145 | 145 | 187 | 145 | 197 | 169 | 151 |
| 2021 | 258 | 147 | 184 | 186 | 147 | 147 | 144 | 134 | 159 | 167 | 187 | 223 |
| 2022 | 163 | 233 | 137 | 150 | 124 | 113 | 119 | 118 | 128 | 124 | 125 | 111 |
| 2023 | 117 | 162 | 144 | 160 | 157 | 143 | 124 | 138 | 116 | 110 | 125 | 183 |
| 2024 | 128 | |||||||||||
| - = No Data Reported; -- = Not Applicable; NA = Not Available; W = Withheld to avoid disclosure of individual company data. |
| Release Date: 3/29/2024 |
| Next Release Date: 4/30/2024 |