|
Download Data (XLS File) |
|
||||||||
|
||||||||
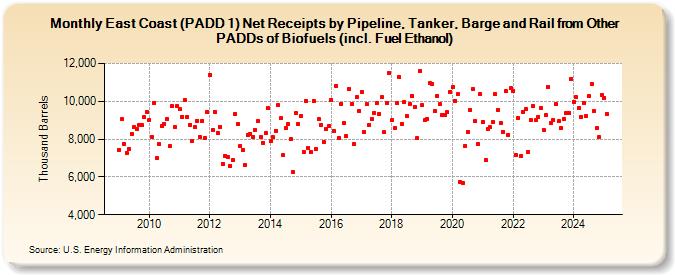
| East Coast (PADD 1) Net Receipts by Pipeline, Tanker, Barge and Rail from Other PADDs of Biofuels (incl. Fuel Ethanol) (Thousand Barrels) | ||||||||
| Year | Jan | Feb | Mar | Apr | May | Jun | Jul | Aug | Sep | Oct | Nov | Dec |
|---|---|---|---|---|---|---|---|---|---|---|---|---|
| 2009 | 7,447 | 9,041 | 7,765 | 7,280 | 7,470 | 8,292 | 8,636 | 8,532 | 8,748 | 8,742 | 9,150 | 9,425 |
| 2010 | 9,001 | 8,137 | 9,933 | 6,985 | 7,737 | 8,698 | 8,800 | 9,068 | 7,643 | 9,742 | 8,645 | 9,741 |
| 2011 | 9,585 | 9,184 | 10,064 | 9,192 | 8,766 | 7,911 | 8,638 | 8,971 | 8,119 | 8,982 | 8,071 | 9,450 |
| 2012 | 11,417 | 8,483 | 9,448 | 8,317 | 8,665 | 6,701 | 7,109 | 7,057 | 6,588 | 6,882 | 9,339 | 8,790 |
| 2013 | 7,647 | 7,414 | 6,624 | 8,219 | 8,280 | 8,102 | 8,490 | 8,934 | 8,109 | 7,815 | 8,307 | 9,653 |
| 2014 | 7,875 | 8,090 | 8,450 | 9,797 | 9,095 | 7,133 | 8,586 | 8,774 | 8,005 | 6,243 | 9,361 | 8,795 |
| 2015 | 9,229 | 7,341 | 10,039 | 7,536 | 7,331 | 10,007 | 7,459 | 9,048 | 8,750 | 7,853 | 8,527 | 8,671 |
| 2016 | 10,081 | 8,444 | 10,832 | 8,061 | 9,867 | 8,833 | 8,162 | 10,656 | 9,851 | 7,744 | 10,205 | 9,491 |
| 2017 | 10,499 | 8,385 | 9,840 | 8,741 | 9,067 | 9,384 | 9,907 | 9,342 | 10,209 | 8,357 | 9,907 | 11,486 |
| 2018 | 8,991 | 8,578 | 9,921 | 11,277 | 8,819 | 9,963 | 9,205 | 9,850 | 10,302 | 9,712 | 8,049 | 11,602 |
| 2019 | 9,782 | 8,984 | 9,084 | 10,953 | 10,926 | 9,484 | 10,303 | 9,842 | 9,260 | 9,291 | 9,415 | 10,500 |
| 2020 | 10,750 | 10,038 | 10,366 | 5,744 | 5,686 | 7,659 | 8,384 | 9,556 | 10,661 | 8,953 | 7,744 | 10,368 |
| 2021 | 8,921 | 6,895 | 8,544 | 8,623 | 8,879 | 10,379 | 9,559 | 8,860 | 8,398 | 10,537 | 8,236 | 10,688 |
| 2022 | 10,546 | 7,173 | 9,124 | 7,104 | 9,453 | 9,567 | 7,321 | 8,990 | 9,746 | 8,992 | 9,184 | 9,640 |
| 2023 | 8,493 | 9,251 | 10,779 | 8,853 | 9,014 | 9,855 | 8,941 | 8,601 | 9,102 | 9,363 | 9,358 | 10,893 |
| 2024 | 10,260 | |||||||||||
| - = No Data Reported; -- = Not Applicable; NA = Not Available; W = Withheld to avoid disclosure of individual company data. |
| Release Date: 3/29/2024 |
| Next Release Date: 4/30/2024 |