|
Download Data (XLS File) |
|
||||||||
|
||||||||
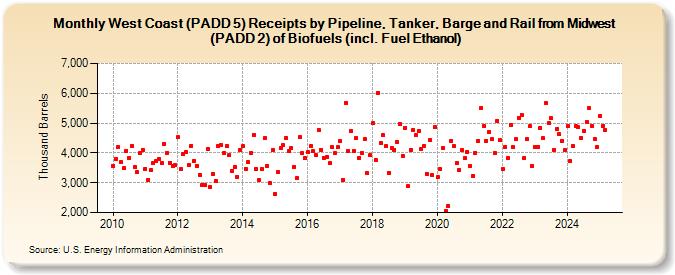
| West Coast (PADD 5) Receipts by Pipeline, Tanker, Barge and Rail from Midwest (PADD 2) of Biofuels (incl. Fuel Ethanol) (Thousand Barrels) | ||||||||
| Year | Jan | Feb | Mar | Apr | May | Jun | Jul | Aug | Sep | Oct | Nov | Dec |
|---|---|---|---|---|---|---|---|---|---|---|---|---|
| 2010 | 3,571 | 3,795 | 4,205 | 3,686 | 3,491 | 4,077 | 3,846 | 4,237 | 3,521 | 3,348 | 4,001 | 4,107 |
| 2011 | 3,477 | 3,096 | 3,415 | 3,662 | 3,728 | 3,805 | 3,664 | 4,309 | 4,013 | 3,672 | 3,561 | 3,579 |
| 2012 | 4,518 | 3,449 | 3,949 | 4,031 | 3,593 | 4,247 | 3,739 | 3,571 | 3,271 | 2,935 | 2,913 | 4,146 |
| 2013 | 2,858 | 3,304 | 3,070 | 4,221 | 4,266 | 4,009 | 4,230 | 3,919 | 3,409 | 3,541 | 3,206 | 4,107 |
| 2014 | 4,223 | 3,476 | 3,687 | 4,005 | 4,615 | 3,455 | 3,083 | 3,465 | 4,493 | 3,559 | 2,976 | 4,094 |
| 2015 | 2,623 | 3,347 | 4,164 | 4,252 | 4,515 | 4,049 | 4,154 | 3,534 | 3,154 | 4,523 | 3,985 | 3,821 |
| 2016 | 4,016 | 4,231 | 4,060 | 3,938 | 4,768 | 4,108 | 3,846 | 3,851 | 3,661 | 4,185 | 3,982 | 4,188 |
| 2017 | 4,398 | 3,107 | 5,679 | 4,057 | 4,731 | 4,067 | 4,486 | 3,839 | 4,001 | 4,461 | 3,314 | 3,914 |
| 2018 | 4,991 | 3,777 | 6,021 | 4,331 | 4,588 | 4,217 | 3,340 | 4,159 | 4,113 | 4,360 | 4,976 | 3,911 |
| 2019 | 4,843 | 2,877 | 4,098 | 4,774 | 4,601 | 4,747 | 4,147 | 4,239 | 3,310 | 4,427 | 3,244 | 4,864 |
| 2020 | 3,197 | 3,447 | 4,159 | 2,069 | 2,225 | 4,414 | 4,232 | 3,654 | 3,441 | 4,096 | 3,838 | 4,041 |
| 2021 | 3,566 | 3,240 | 4,007 | 4,402 | 5,497 | 4,915 | 4,402 | 4,699 | 4,454 | 4,005 | 5,080 | 4,441 |
| 2022 | 3,454 | 4,199 | 3,829 | 4,942 | 4,194 | 4,453 | 5,185 | 5,266 | 3,843 | 4,456 | 4,893 | 3,566 |
| 2023 | 4,211 | 4,210 | 4,844 | 4,487 | 5,659 | 4,996 | 5,165 | 4,112 | 4,788 | 4,624 | 4,413 | 4,098 |
| 2024 | 4,907 | 3,719 | 4,217 | 4,906 | 4,868 | 4,524 | ||||||
| - = No Data Reported; -- = Not Applicable; NA = Not Available; W = Withheld to avoid disclosure of individual company data. |
| Release Date: 8/30/2024 |
| Next Release Date: 9/30/2024 |