|
Download Data (XLS File) |
|
||||||||
|
||||||||
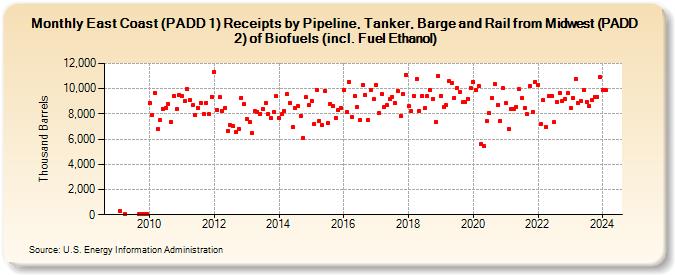
| East Coast (PADD 1) Receipts by Pipeline, Tanker, Barge and Rail from Midwest (PADD 2) of Biofuels (incl. Fuel Ethanol) (Thousand Barrels) | ||||||||
| Year | Jan | Feb | Mar | Apr | May | Jun | Jul | Aug | Sep | Oct | Nov | Dec |
|---|---|---|---|---|---|---|---|---|---|---|---|---|
| 2009 | 287 | 20 | 25 | 65 | 26 | 50 | ||||||
| 2010 | 8,902 | 7,929 | 9,686 | 6,772 | 7,481 | 8,415 | 8,499 | 8,785 | 7,360 | 9,442 | 8,364 | 9,466 |
| 2011 | 9,435 | 9,059 | 9,952 | 9,091 | 8,693 | 7,886 | 8,502 | 8,871 | 8,001 | 8,900 | 7,971 | 9,380 |
| 2012 | 11,345 | 8,345 | 9,301 | 8,235 | 8,476 | 6,676 | 7,084 | 7,007 | 6,588 | 6,817 | 9,300 | 8,762 |
| 2013 | 7,622 | 7,386 | 6,470 | 8,190 | 8,152 | 8,020 | 8,394 | 8,852 | 7,979 | 7,680 | 8,164 | 9,418 |
| 2014 | 7,652 | 7,963 | 8,229 | 9,563 | 8,895 | 6,928 | 8,467 | 8,589 | 7,860 | 6,090 | 9,301 | 8,700 |
| 2015 | 9,059 | 7,199 | 9,930 | 7,465 | 7,104 | 9,846 | 7,247 | 8,812 | 8,622 | 7,705 | 8,271 | 8,441 |
| 2016 | 9,886 | 8,137 | 10,552 | 7,758 | 9,398 | 8,575 | 7,554 | 10,324 | 9,501 | 7,492 | 9,898 | 9,159 |
| 2017 | 10,294 | 8,053 | 9,559 | 8,513 | 8,703 | 9,148 | 9,378 | 8,844 | 9,800 | 7,846 | 9,570 | 11,110 |
| 2018 | 8,602 | 8,193 | 9,426 | 10,747 | 8,251 | 9,455 | 8,462 | 9,393 | 9,914 | 9,218 | 7,373 | 11,019 |
| 2019 | 9,421 | 8,528 | 8,698 | 10,576 | 10,490 | 9,289 | 10,039 | 9,747 | 8,915 | 8,964 | 9,216 | 10,041 |
| 2020 | 10,568 | 9,857 | 10,184 | 5,614 | 5,419 | 7,400 | 8,065 | 9,291 | 10,359 | 8,739 | 7,464 | 10,031 |
| 2021 | 8,828 | 6,779 | 8,373 | 8,396 | 8,580 | 9,943 | 9,245 | 8,504 | 7,964 | 10,202 | 8,176 | 10,547 |
| 2022 | 10,323 | 7,188 | 9,098 | 6,967 | 9,439 | 9,456 | 7,322 | 8,953 | 9,666 | 8,992 | 9,169 | 9,640 |
| 2023 | 8,490 | 9,257 | 10,779 | 8,866 | 9,019 | 9,860 | 8,947 | 8,601 | 9,069 | 9,343 | 9,348 | 10,893 |
| 2024 | 10,260 | |||||||||||
| - = No Data Reported; -- = Not Applicable; NA = Not Available; W = Withheld to avoid disclosure of individual company data. |
| Release Date: 3/29/2024 |
| Next Release Date: 4/30/2024 |