|
Download Data (XLS File) |
|
||||||||
|
||||||||
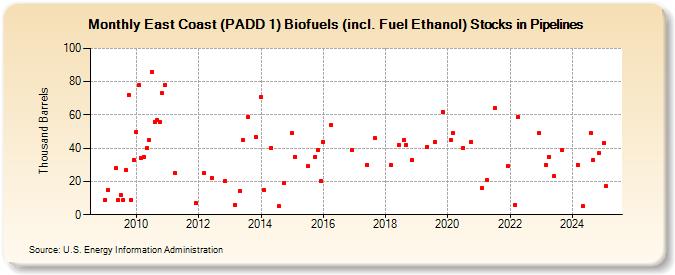
| East Coast (PADD 1) Biofuels (incl. Fuel Ethanol) Stocks in Pipelines (Thousand Barrels) | ||||||||
| Year | Jan | Feb | Mar | Apr | May | Jun | Jul | Aug | Sep | Oct | Nov | Dec |
|---|---|---|---|---|---|---|---|---|---|---|---|---|
| 2009 | 9 | 15 | 28 | 9 | 12 | 9 | 27 | 72 | 9 | 33 | ||
| 2010 | 50 | 78 | 34 | 35 | 40 | 45 | 86 | 56 | 57 | 56 | 73 | 78 |
| 2011 | 25 | 7 | ||||||||||
| 2012 | 25 | 22 | 20 | |||||||||
| 2013 | 6 | 14 | 45 | 59 | 47 | |||||||
| 2014 | 71 | 15 | 40 | 5 | 19 | |||||||
| 2015 | 49 | 35 | 29 | 35 | 39 | 20 | ||||||
| 2016 | 44 | 54 | 39 | |||||||||
| 2017 | 30 | 46 | ||||||||||
| 2018 | 30 | 42 | 45 | 42 | 33 | |||||||
| 2019 | 41 | 44 | 62 | |||||||||
| 2020 | 45 | 49 | 40 | 44 | ||||||||
| 2021 | 16 | 21 | 64 | 29 | ||||||||
| 2022 | 6 | 59 | 49 | |||||||||
| 2023 | 30 | 35 | 23 | 39 | ||||||||
| - = No Data Reported; -- = Not Applicable; NA = Not Available; W = Withheld to avoid disclosure of individual company data. |
| Release Date: 3/29/2024 |
| Next Release Date: 4/30/2024 |