|
Download Data (XLS File) |
|
||||||||
|
||||||||
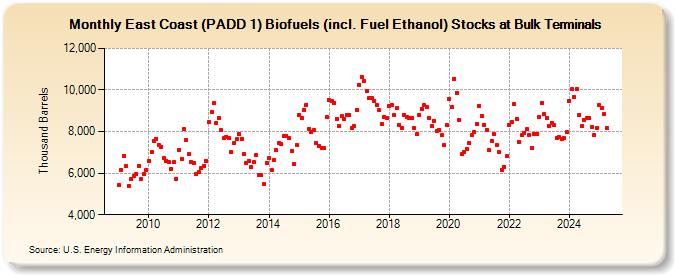
| East Coast (PADD 1) Biofuels (incl. Fuel Ethanol) Stocks at Bulk Terminals (Thousand Barrels) | ||||||||
| Year | Jan | Feb | Mar | Apr | May | Jun | Jul | Aug | Sep | Oct | Nov | Dec |
|---|---|---|---|---|---|---|---|---|---|---|---|---|
| 2009 | 5,433 | 6,168 | 6,834 | 6,342 | 5,400 | 5,719 | 5,851 | 5,974 | 6,332 | 5,722 | 5,935 | 6,153 |
| 2010 | 6,604 | 7,017 | 7,549 | 7,655 | 7,347 | 7,271 | 6,734 | 6,606 | 6,528 | 6,207 | 6,516 | 5,739 |
| 2011 | 7,132 | 6,695 | 8,120 | 7,610 | 6,908 | 6,557 | 6,470 | 5,976 | 6,051 | 6,244 | 6,339 | 6,583 |
| 2012 | 8,444 | 8,941 | 9,359 | 8,405 | 8,660 | 8,062 | 7,681 | 7,753 | 7,672 | 7,006 | 7,459 | 7,629 |
| 2013 | 7,859 | 7,643 | 6,923 | 6,474 | 6,595 | 6,293 | 6,514 | 6,853 | 5,921 | 5,896 | 5,481 | 6,506 |
| 2014 | 6,712 | 6,129 | 6,622 | 7,097 | 7,432 | 7,401 | 7,805 | 7,796 | 7,697 | 7,080 | 6,420 | 7,358 |
| 2015 | 8,817 | 8,645 | 9,043 | 9,293 | 8,135 | 7,989 | 8,081 | 7,445 | 7,307 | 7,199 | 7,192 | 8,681 |
| 2016 | 9,508 | 9,452 | 9,393 | 8,600 | 8,275 | 8,738 | 8,606 | 8,794 | 8,798 | 8,171 | 8,252 | 9,060 |
| 2017 | 10,263 | 10,637 | 10,455 | 9,945 | 9,608 | 9,614 | 9,451 | 9,275 | 9,022 | 8,360 | 8,710 | 8,664 |
| 2018 | 9,235 | 9,281 | 8,785 | 9,109 | 8,309 | 8,183 | 8,806 | 8,682 | 8,649 | 8,664 | 8,177 | 7,871 |
| 2019 | 8,819 | 9,075 | 9,261 | 9,200 | 8,631 | 8,246 | 8,529 | 8,015 | 8,076 | 7,821 | 7,334 | 8,301 |
| 2020 | 9,572 | 9,163 | 10,540 | 9,864 | 8,554 | 6,914 | 6,994 | 7,171 | 7,472 | 7,833 | 7,959 | 8,363 |
| 2021 | 9,241 | 8,761 | 8,325 | 8,091 | 7,102 | 7,565 | 7,867 | 7,366 | 6,995 | 6,170 | 6,305 | 6,813 |
| 2022 | 8,332 | 8,443 | 9,327 | 8,595 | 7,504 | 7,817 | 7,931 | 8,108 | 7,834 | 7,213 | 7,895 | 7,902 |
| 2023 | 8,675 | 9,381 | 8,804 | 8,604 | 8,253 | 8,432 | 8,298 | 7,699 | 7,714 | 7,645 | 7,696 | 7,976 |
| 2024 | 9,481 | 10,053 | 9,658 | 10,049 | ||||||||
| - = No Data Reported; -- = Not Applicable; NA = Not Available; W = Withheld to avoid disclosure of individual company data. |
| Release Date: 6/28/2024 |
| Next Release Date: 7/31/2024 |