|
Download Data (XLS File) |
|
||||||||
|
||||||||
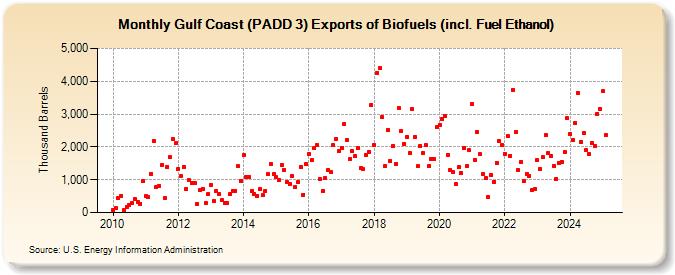
| Gulf Coast (PADD 3) Exports of Biofuels (incl. Fuel Ethanol) (Thousand Barrels) | ||||||||
| Year | Jan | Feb | Mar | Apr | May | Jun | Jul | Aug | Sep | Oct | Nov | Dec |
|---|---|---|---|---|---|---|---|---|---|---|---|---|
| 2010 | 84 | 128 | 455 | 507 | 76 | 172 | 219 | 284 | 420 | 332 | 275 | 955 |
| 2011 | 497 | 462 | 1,183 | 2,173 | 765 | 814 | 1,457 | 430 | 1,390 | 1,680 | 2,230 | 2,108 |
| 2012 | 1,327 | 1,115 | 1,390 | 721 | 977 | 893 | 914 | 260 | 672 | 727 | 294 | 560 |
| 2013 | 852 | 359 | 655 | 568 | 372 | 289 | 286 | 551 | 667 | 668 | 1,409 | 976 |
| 2014 | 1,745 | 1,080 | 1,086 | 664 | 570 | 514 | 703 | 522 | 666 | 1,162 | 1,470 | 1,172 |
| 2015 | 1,075 | 996 | 1,443 | 1,289 | 943 | 863 | 1,110 | 771 | 935 | 1,399 | 550 | 1,465 |
| 2016 | 1,786 | 1,598 | 1,954 | 2,052 | 1,024 | 660 | 1,048 | 1,296 | 1,235 | 2,053 | 2,242 | 1,878 |
| 2017 | 1,977 | 2,701 | 2,216 | 1,629 | 1,869 | 1,715 | 1,966 | 1,357 | 1,312 | 1,764 | 1,847 | 3,277 |
| 2018 | 2,062 | 4,264 | 4,396 | 2,911 | 1,410 | 2,524 | 1,573 | 2,030 | 1,489 | 3,174 | 2,482 | 2,100 |
| 2019 | 2,306 | 1,821 | 3,161 | 2,315 | 1,403 | 2,033 | 1,820 | 2,044 | 1,413 | 1,633 | 1,632 | 2,605 |
| 2020 | 2,669 | 2,863 | 2,954 | 1,767 | 1,295 | 1,243 | 857 | 1,379 | 1,206 | 1,966 | 1,410 | 1,899 |
| 2021 | 3,303 | 1,616 | 2,463 | 1,770 | 1,164 | 1,059 | 473 | 1,146 | 943 | 1,523 | 2,171 | 2,056 |
| 2022 | 1,794 | 2,330 | 1,733 | 3,733 | 2,463 | 1,289 | 1,545 | 950 | 1,173 | 1,127 | 687 | 710 |
| 2023 | 1,516 | 1,222 | 1,935 | 2,370 | 1,824 | 1,712 | 1,401 | 1,021 | 1,502 | 1,556 | 1,845 | 2,867 |
| 2024 | 2,396 | 2,214 | 2,723 | 3,642 | ||||||||
| - = No Data Reported; -- = Not Applicable; NA = Not Available; W = Withheld to avoid disclosure of individual company data. |
| Release Date: 6/28/2024 |
| Next Release Date: 7/31/2024 |