|
Download Data (XLS File) |
|
||||||||
|
||||||||
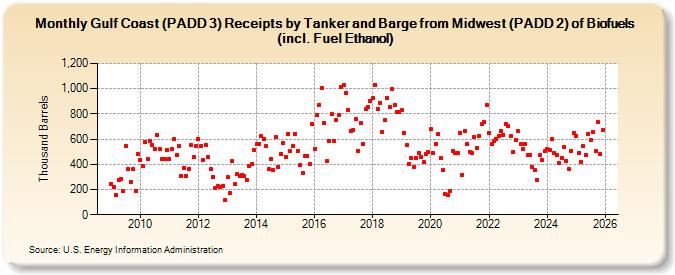
| Gulf Coast (PADD 3) Receipts by Tanker and Barge from Midwest (PADD 2) of Biofuels (incl. Fuel Ethanol) (Thousand Barrels) | ||||||||
| Year | Jan | Feb | Mar | Apr | May | Jun | Jul | Aug | Sep | Oct | Nov | Dec |
|---|---|---|---|---|---|---|---|---|---|---|---|---|
| 2009 | 245 | 216 | 158 | 276 | 280 | 188 | 549 | 362 | 263 | 362 | 185 | 480 |
| 2010 | 433 | 388 | 578 | 443 | 588 | 551 | 525 | 634 | 520 | 444 | 439 | 513 |
| 2011 | 445 | 519 | 598 | 472 | 545 | 311 | 373 | 308 | 359 | 553 | 457 | 546 |
| 2012 | 602 | 543 | 432 | 557 | 455 | 360 | 299 | 214 | 230 | 216 | 231 | 115 |
| 2013 | 299 | 172 | 425 | 241 | 324 | 306 | 312 | 304 | 277 | 384 | 401 | 512 |
| 2014 | 559 | 565 | 621 | 603 | 544 | 361 | 441 | 354 | 613 | 381 | 483 | 567 |
| 2015 | 458 | 641 | 503 | 547 | 641 | 506 | 393 | 328 | 463 | 469 | 403 | 719 |
| 2016 | 525 | 793 | 870 | 1,006 | 728 | 430 | 585 | 798 | 586 | 753 | 788 | 1,014 |
| 2017 | 1,027 | 966 | 831 | 666 | 671 | 757 | 507 | 726 | 560 | 838 | 852 | 902 |
| 2018 | 924 | 1,030 | 837 | 889 | 660 | 751 | 930 | 852 | 997 | 867 | 818 | 812 |
| 2019 | 827 | 650 | 553 | 404 | 448 | 376 | 448 | 490 | 456 | 415 | 484 | 497 |
| 2020 | 678 | 491 | 565 | 638 | 451 | 351 | 163 | 158 | 192 | 505 | 491 | 490 |
| 2021 | 651 | 316 | 665 | 559 | 498 | 493 | 620 | 532 | 625 | 718 | 734 | 872 |
| 2022 | 647 | 561 | 582 | 603 | 622 | 666 | 636 | 718 | 702 | 621 | 500 | 589 |
| 2023 | 661 | 559 | 525 | 563 | 470 | 474 | 376 | 357 | 278 | 474 | 434 | 505 |
| 2024 | 518 | |||||||||||
| - = No Data Reported; -- = Not Applicable; NA = Not Available; W = Withheld to avoid disclosure of individual company data. |
| Release Date: 3/29/2024 |
| Next Release Date: 4/30/2024 |