|
Download Data (XLS File) |
|
||||||||
|
||||||||
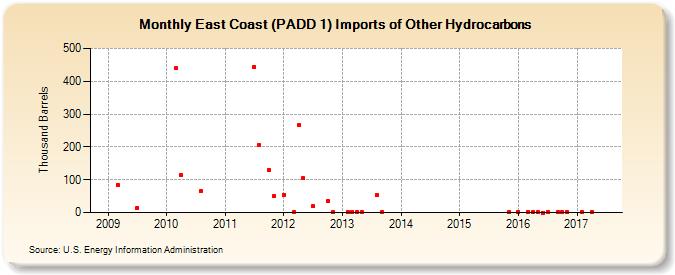
| East Coast (PADD 1) Imports of Other Hydrocarbons (Thousand Barrels) | ||||||||
| Year | Jan | Feb | Mar | Apr | May | Jun | Jul | Aug | Sep | Oct | Nov | Dec |
|---|---|---|---|---|---|---|---|---|---|---|---|---|
| 2009 | 85 | 14 | ||||||||||
| 2010 | 439 | 114 | 65 | |||||||||
| 2011 | 444 | 205 | 129 | 50 | ||||||||
| 2012 | 55 | 1 | 266 | 105 | 19 | 35 | 1 | |||||
| 2013 | 1 | 1 | 1 | 1 | 54 | 1 | ||||||
| 2015 | 1 | |||||||||||
| 2016 | 1 | 3 | 1 | 1 | 0 | 1 | 1 | 1 | 1 | |||
| 2017 | 1 | 1 | ||||||||||
| - = No Data Reported; -- = Not Applicable; NA = Not Available; W = Withheld to avoid disclosure of individual company data. |
| Release Date: 3/29/2024 |
| Next Release Date: 4/30/2024 |