|
Download Data (XLS File) |
|
||||||||
|
||||||||
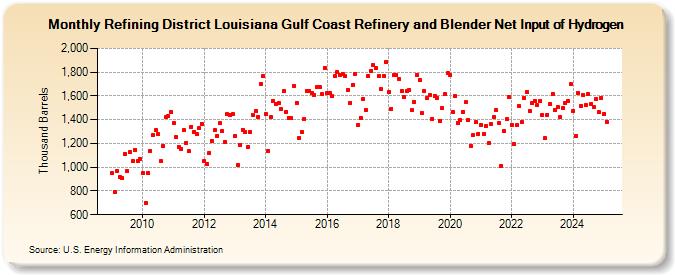
| Refining District Louisiana Gulf Coast Refinery and Blender Net Input of Hydrogen (Thousand Barrels) | ||||||||
| Year | Jan | Feb | Mar | Apr | May | Jun | Jul | Aug | Sep | Oct | Nov | Dec |
|---|---|---|---|---|---|---|---|---|---|---|---|---|
| 2009 | 948 | 793 | 964 | 919 | 909 | 1,114 | 964 | 1,127 | 1,048 | 1,147 | 1,055 | 1,073 |
| 2010 | 949 | 699 | 948 | 1,136 | 1,269 | 1,312 | 1,279 | 1,050 | 1,181 | 1,419 | 1,428 | 1,466 |
| 2011 | 1,374 | 1,250 | 1,171 | 1,154 | 1,312 | 1,204 | 1,133 | 1,342 | 1,300 | 1,283 | 1,329 | 1,366 |
| 2012 | 1,051 | 1,028 | 1,120 | 1,222 | 1,310 | 1,266 | 1,368 | 1,304 | 1,216 | 1,445 | 1,438 | 1,446 |
| 2013 | 1,261 | 1,019 | 1,185 | 1,317 | 1,294 | 1,174 | 1,295 | 1,441 | 1,469 | 1,424 | 1,703 | 1,767 |
| 2014 | 1,447 | 1,137 | 1,419 | 1,557 | 1,532 | 1,541 | 1,489 | 1,641 | 1,468 | 1,418 | 1,412 | 1,686 |
| 2015 | 1,544 | 1,247 | 1,295 | 1,404 | 1,645 | 1,643 | 1,628 | 1,611 | 1,675 | 1,679 | 1,615 | 1,839 |
| 2016 | 1,623 | 1,622 | 1,597 | 1,764 | 1,800 | 1,780 | 1,783 | 1,765 | 1,648 | 1,543 | 1,696 | 1,785 |
| 2017 | 1,357 | 1,418 | 1,576 | 1,483 | 1,769 | 1,810 | 1,859 | 1,833 | 1,765 | 1,656 | 1,767 | 1,886 |
| 2018 | 1,631 | 1,494 | 1,774 | 1,772 | 1,741 | 1,642 | 1,593 | 1,643 | 1,650 | 1,479 | 1,551 | 1,778 |
| 2019 | 1,735 | 1,455 | 1,639 | 1,583 | 1,606 | 1,409 | 1,603 | 1,583 | 1,387 | 1,499 | 1,612 | 1,792 |
| 2020 | 1,780 | 1,465 | 1,596 | 1,375 | 1,399 | 1,467 | 1,546 | 1,399 | 1,179 | 1,271 | 1,378 | 1,281 |
| 2021 | 1,358 | 1,283 | 1,345 | 1,202 | 1,364 | 1,426 | 1,479 | 1,375 | 1,009 | 1,301 | 1,404 | 1,589 |
| 2022 | 1,358 | 1,195 | 1,353 | 1,515 | 1,381 | 1,584 | 1,632 | 1,473 | 1,542 | 1,553 | 1,521 | 1,559 |
| 2023 | 1,440 | 1,242 | 1,442 | 1,532 | 1,618 | 1,483 | 1,504 | 1,423 | 1,498 | 1,541 | 1,559 | 1,697 |
| 2024 | 1,474 | |||||||||||
| - = No Data Reported; -- = Not Applicable; NA = Not Available; W = Withheld to avoid disclosure of individual company data. |
| Release Date: 3/29/2024 |
| Next Release Date: 4/30/2024 |