|
Download Data (XLS File) |
|
||||||||
|
||||||||
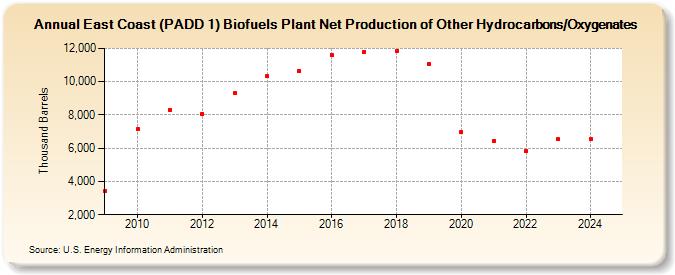
| East Coast (PADD 1) Biofuels Plant Net Production of Other Hydrocarbons/Oxygenates (Thousand Barrels) | ||||||||
| Decade | Year-0 | Year-1 | Year-2 | Year-3 | Year-4 | Year-5 | Year-6 | Year-7 | Year-8 | Year-9 |
|---|---|---|---|---|---|---|---|---|---|---|
| 2000's | 3,398 | |||||||||
| 2010's | 7,151 | 8,315 | 8,066 | 9,292 | 10,323 | 10,628 | 11,623 | 11,810 | 11,854 | 11,066 |
| 2020's | 6,959 | 6,439 | 5,837 | 6,527 |
| - = No Data Reported; -- = Not Applicable; NA = Not Available; W = Withheld to avoid disclosure of individual company data. |
| Release Date: 3/29/2024 |
| Next Release Date: 8/30/2024 |