|
Download Data (XLS File) |
|
||||||||
|
||||||||
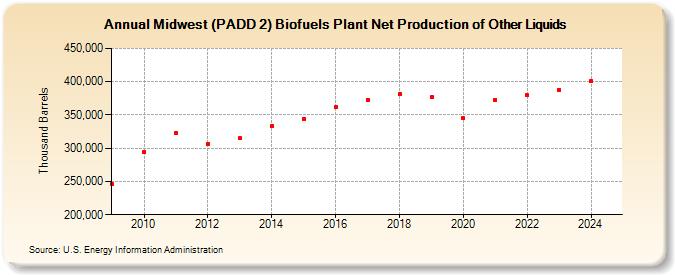
| Midwest (PADD 2) Biofuels Plant Net Production of Other Liquids (Thousand Barrels) | ||||||||
| Decade | Year-0 | Year-1 | Year-2 | Year-3 | Year-4 | Year-5 | Year-6 | Year-7 | Year-8 | Year-9 |
|---|---|---|---|---|---|---|---|---|---|---|
| 2000's | 246,118 | |||||||||
| 2010's | 294,300 | 323,070 | 306,630 | 315,227 | 334,057 | 343,681 | 361,258 | 372,961 | 381,246 | 376,369 |
| 2020's | 345,070 | 372,777 | 379,369 | 388,680 |
| - = No Data Reported; -- = Not Applicable; NA = Not Available; W = Withheld to avoid disclosure of individual company data. |
| Release Date: 3/29/2024 |
| Next Release Date: 8/30/2024 |