|
Download Data (XLS File) |
|
||||||||
|
||||||||
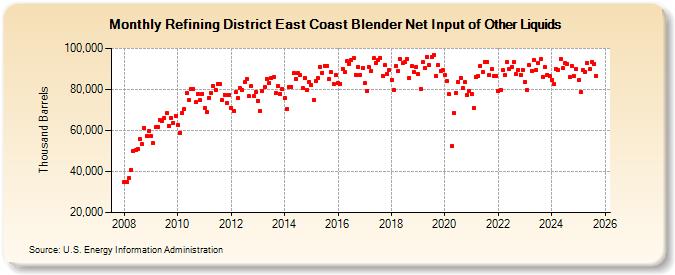
| Refining District East Coast Blender Net Input of Other Liquids (Thousand Barrels) | ||||||||
| Year | Jan | Feb | Mar | Apr | May | Jun | Jul | Aug | Sep | Oct | Nov | Dec |
|---|---|---|---|---|---|---|---|---|---|---|---|---|
| 2008 | 34,703 | 34,884 | 36,682 | 40,926 | 49,823 | 50,386 | 50,761 | 55,809 | 53,216 | 61,256 | 57,234 | 59,630 |
| 2009 | 57,490 | 53,721 | 61,457 | 61,737 | 65,086 | 64,589 | 66,276 | 68,315 | 62,301 | 66,207 | 63,810 | 67,158 |
| 2010 | 62,875 | 58,897 | 68,638 | 70,492 | 78,059 | 74,954 | 80,428 | 80,135 | 73,633 | 77,942 | 74,652 | 77,959 |
| 2011 | 70,881 | 68,798 | 75,871 | 78,469 | 81,625 | 79,940 | 82,854 | 82,441 | 74,789 | 77,446 | 73,542 | 77,430 |
| 2012 | 71,140 | 69,711 | 78,637 | 75,831 | 80,507 | 79,681 | 83,441 | 85,287 | 76,564 | 81,594 | 76,641 | 78,747 |
| 2013 | 74,529 | 69,412 | 79,190 | 81,429 | 85,124 | 83,174 | 85,436 | 85,967 | 78,398 | 81,638 | 77,954 | 80,242 |
| 2014 | 75,838 | 70,514 | 81,024 | 81,221 | 87,794 | 85,191 | 87,819 | 87,019 | 80,663 | 85,582 | 79,746 | 83,833 |
| 2015 | 82,125 | 74,853 | 84,192 | 85,436 | 91,109 | 88,196 | 91,435 | 91,559 | 84,900 | 88,295 | 82,561 | 86,933 |
| 2016 | 83,149 | 82,816 | 90,144 | 88,597 | 93,694 | 92,594 | 94,408 | 95,421 | 87,179 | 91,157 | 87,145 | 90,575 |
| 2017 | 83,061 | 79,367 | 90,739 | 89,071 | 95,118 | 93,061 | 94,242 | 95,485 | 86,653 | 91,723 | 87,550 | 89,538 |
| 2018 | 84,751 | 79,828 | 91,265 | 88,988 | 94,743 | 92,895 | 93,336 | 94,896 | 85,573 | 91,296 | 88,595 | 90,862 |
| 2019 | 87,541 | 80,046 | 93,132 | 90,629 | 96,030 | 91,808 | 95,881 | 96,888 | 86,610 | 91,784 | 89,073 | 89,234 |
| 2020 | 87,038 | 84,037 | 77,570 | 52,263 | 68,396 | 78,434 | 83,825 | 85,660 | 80,697 | 83,601 | 77,299 | 79,237 |
| 2021 | 77,661 | 70,984 | 85,911 | 86,654 | 91,618 | 88,670 | 93,406 | 93,458 | 86,950 | 89,930 | 86,740 | 86,626 |
| 2022 | 79,036 | 79,942 | 89,309 | 86,865 | 93,224 | 90,096 | 91,000 | 93,473 | 87,353 | 89,640 | 87,182 | 89,608 |
| 2023 | 83,722 | 79,673 | 91,735 | 89,138 | 94,413 | 89,667 | 93,108 | 94,662 | 86,205 | 90,920 | 87,204 | 86,432 |
| 2024 | 84,766 | |||||||||||
| - = No Data Reported; -- = Not Applicable; NA = Not Available; W = Withheld to avoid disclosure of individual company data. |
| Release Date: 3/29/2024 |
| Next Release Date: 4/30/2024 |
Referring Pages: