|
Download Data (XLS File) |
|
||||||||
|
||||||||
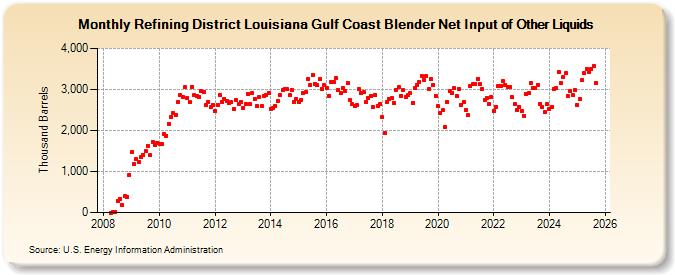
| Refining District Louisiana Gulf Coast Blender Net Input of Other Liquids (Thousand Barrels) | ||||||||
| Year | Jan | Feb | Mar | Apr | May | Jun | Jul | Aug | Sep | Oct | Nov | Dec |
|---|---|---|---|---|---|---|---|---|---|---|---|---|
| 2008 | 1 | 2 | 14 | 292 | 340 | 183 | 393 | 383 | 908 | |||
| 2009 | 1,464 | 1,181 | 1,303 | 1,237 | 1,365 | 1,405 | 1,498 | 1,626 | 1,397 | 1,729 | 1,644 | 1,705 |
| 2010 | 1,680 | 1,674 | 1,913 | 1,877 | 2,161 | 2,336 | 2,417 | 2,382 | 2,704 | 2,854 | 2,827 | 3,053 |
| 2011 | 2,796 | 2,682 | 3,066 | 2,856 | 2,852 | 2,823 | 2,963 | 2,928 | 2,629 | 2,703 | 2,563 | 2,627 |
| 2012 | 2,470 | 2,630 | 2,867 | 2,705 | 2,779 | 2,728 | 2,660 | 2,692 | 2,522 | 2,736 | 2,639 | 2,705 |
| 2013 | 2,551 | 2,652 | 2,896 | 2,654 | 2,919 | 2,776 | 2,596 | 2,808 | 2,586 | 2,834 | 2,872 | 2,912 |
| 2014 | 2,532 | 2,555 | 2,602 | 2,716 | 2,868 | 2,997 | 3,015 | 3,005 | 2,856 | 2,993 | 2,684 | 2,776 |
| 2015 | 2,694 | 2,753 | 2,918 | 2,926 | 3,251 | 3,106 | 3,356 | 3,143 | 3,098 | 3,251 | 3,020 | 3,096 |
| 2016 | 3,043 | 2,846 | 3,192 | 3,176 | 3,270 | 2,994 | 2,908 | 3,027 | 2,955 | 3,160 | 2,747 | 2,637 |
| 2017 | 2,607 | 2,610 | 3,005 | 2,903 | 2,933 | 2,695 | 2,794 | 2,832 | 2,577 | 2,863 | 2,607 | 2,641 |
| 2018 | 2,319 | 1,946 | 2,683 | 2,756 | 2,784 | 2,668 | 2,989 | 3,051 | 2,851 | 2,978 | 2,813 | 2,855 |
| 2019 | 2,906 | 2,680 | 3,033 | 3,117 | 3,186 | 3,327 | 3,240 | 3,324 | 3,007 | 3,249 | 3,102 | 2,848 |
| 2020 | 2,590 | 2,421 | 2,489 | 2,094 | 2,690 | 2,952 | 2,913 | 3,029 | 2,845 | 3,011 | 2,610 | 2,697 |
| 2021 | 2,508 | 2,365 | 3,072 | 3,133 | 3,131 | 3,262 | 3,130 | 3,016 | 2,749 | 2,800 | 2,642 | 2,826 |
| 2022 | 2,483 | 2,574 | 3,072 | 3,078 | 3,203 | 3,113 | 3,068 | 3,062 | 2,807 | 2,642 | 2,511 | 2,572 |
| 2023 | 2,475 | 2,361 | 2,891 | 2,913 | 3,154 | 3,027 | 3,047 | 3,118 | 2,655 | 2,570 | 2,440 | 2,643 |
| 2024 | 2,524 | 2,565 | 3,013 | 3,037 | ||||||||
| - = No Data Reported; -- = Not Applicable; NA = Not Available; W = Withheld to avoid disclosure of individual company data. |
| Release Date: 6/28/2024 |
| Next Release Date: 7/31/2024 |
Referring Pages: