|
Download Data (XLS File) |
|
||||||||
|
||||||||
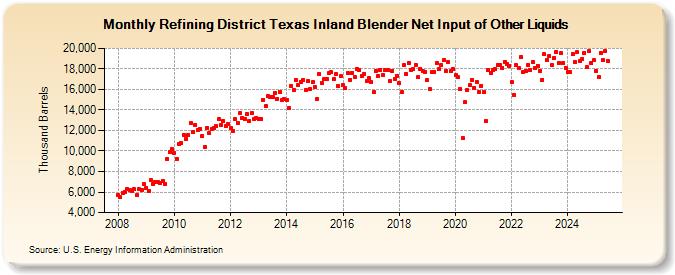
| Refining District Texas Inland Blender Net Input of Other Liquids (Thousand Barrels) | ||||||||
| Year | Jan | Feb | Mar | Apr | May | Jun | Jul | Aug | Sep | Oct | Nov | Dec |
|---|---|---|---|---|---|---|---|---|---|---|---|---|
| 2008 | 5,721 | 5,470 | 5,938 | 5,990 | 6,309 | 6,165 | 6,122 | 6,266 | 5,689 | 6,269 | 6,209 | 6,761 |
| 2009 | 6,421 | 6,093 | 7,136 | 6,818 | 6,997 | 7,026 | 6,915 | 7,119 | 6,828 | 9,220 | 9,877 | 10,182 |
| 2010 | 9,809 | 9,216 | 10,641 | 10,775 | 11,542 | 11,198 | 11,551 | 12,744 | 11,877 | 12,547 | 12,069 | 12,135 |
| 2011 | 11,457 | 10,409 | 12,249 | 11,711 | 12,167 | 12,219 | 12,445 | 13,098 | 12,581 | 12,908 | 12,438 | 12,651 |
| 2012 | 12,265 | 11,993 | 13,115 | 12,735 | 13,690 | 13,209 | 13,136 | 13,598 | 12,939 | 13,694 | 13,115 | 13,263 |
| 2013 | 13,139 | 13,142 | 14,999 | 14,370 | 15,335 | 15,292 | 15,214 | 15,683 | 15,098 | 15,749 | 14,966 | 15,021 |
| 2014 | 14,984 | 14,182 | 16,356 | 15,972 | 16,927 | 16,443 | 16,751 | 16,928 | 15,907 | 16,813 | 16,020 | 16,677 |
| 2015 | 16,226 | 15,113 | 17,524 | 16,624 | 16,994 | 17,060 | 17,553 | 17,692 | 16,976 | 17,464 | 16,334 | 17,261 |
| 2016 | 16,385 | 16,120 | 17,579 | 16,957 | 17,631 | 17,220 | 17,995 | 17,925 | 17,338 | 17,550 | 16,781 | 17,108 |
| 2017 | 16,712 | 15,720 | 17,800 | 17,317 | 17,940 | 17,428 | 17,887 | 17,857 | 16,820 | 17,839 | 17,013 | 17,342 |
| 2018 | 16,595 | 15,711 | 18,336 | 17,551 | 18,593 | 17,856 | 17,961 | 18,425 | 17,203 | 17,988 | 17,779 | 17,744 |
| 2019 | 16,918 | 16,011 | 17,694 | 17,744 | 18,537 | 17,985 | 18,346 | 18,868 | 17,840 | 18,664 | 17,750 | 18,016 |
| 2020 | 17,364 | 17,173 | 16,058 | 11,266 | 14,740 | 15,966 | 16,384 | 16,923 | 16,160 | 16,731 | 15,705 | 16,356 |
| 2021 | 15,728 | 12,907 | 17,905 | 17,646 | 17,917 | 17,944 | 18,366 | 18,385 | 18,115 | 18,716 | 18,458 | 18,315 |
| 2022 | 16,718 | 15,496 | 18,353 | 18,100 | 19,159 | 17,736 | 17,818 | 18,358 | 17,914 | 18,659 | 18,084 | 18,329 |
| 2023 | 17,710 | 16,816 | 19,357 | 18,864 | 19,276 | 18,487 | 19,039 | 19,680 | 18,663 | 19,505 | 18,571 | 18,032 |
| 2024 | 17,695 | |||||||||||
| - = No Data Reported; -- = Not Applicable; NA = Not Available; W = Withheld to avoid disclosure of individual company data. |
| Release Date: 3/29/2024 |
| Next Release Date: 4/30/2024 |
Referring Pages: