|
Download Data (XLS File) |
|
||||||||
|
||||||||
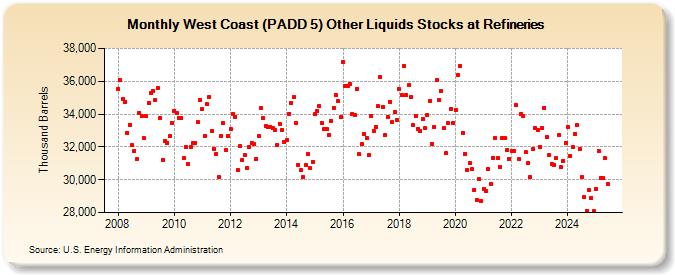
| West Coast (PADD 5) Other Liquids Stocks at Refineries (Thousand Barrels) | ||||||||
| Year | Jan | Feb | Mar | Apr | May | Jun | Jul | Aug | Sep | Oct | Nov | Dec |
|---|---|---|---|---|---|---|---|---|---|---|---|---|
| 2008 | 35,543 | 36,046 | 34,947 | 34,761 | 32,858 | 33,350 | 32,095 | 31,757 | 31,253 | 34,094 | 33,860 | 32,547 |
| 2009 | 33,866 | 34,696 | 35,268 | 35,428 | 34,870 | 35,595 | 33,775 | 31,230 | 32,387 | 32,238 | 32,636 | 33,484 |
| 2010 | 34,207 | 34,094 | 33,766 | 33,745 | 31,313 | 32,020 | 30,986 | 31,994 | 32,248 | 32,267 | 33,487 | 34,877 |
| 2011 | 34,287 | 32,676 | 34,609 | 35,031 | 32,987 | 31,895 | 31,597 | 30,179 | 32,682 | 33,460 | 31,800 | 32,683 |
| 2012 | 33,083 | 34,018 | 33,818 | 30,585 | 32,045 | 31,172 | 31,526 | 30,710 | 32,008 | 32,258 | 32,149 | 31,272 |
| 2013 | 32,687 | 34,387 | 33,773 | 33,255 | 33,188 | 33,234 | 33,132 | 33,022 | 32,127 | 33,423 | 33,056 | 32,289 |
| 2014 | 32,417 | 34,026 | 34,680 | 35,062 | 33,481 | 30,905 | 30,568 | 30,174 | 30,897 | 31,573 | 30,685 | 31,110 |
| 2015 | 33,997 | 34,160 | 34,488 | 33,482 | 33,093 | 33,076 | 32,714 | 33,594 | 34,389 | 35,161 | 34,768 | 33,801 |
| 2016 | 37,181 | 35,695 | 35,723 | 35,844 | 34,005 | 33,961 | 35,555 | 31,546 | 32,155 | 32,778 | 32,558 | 31,506 |
| 2017 | 33,907 | 32,971 | 33,231 | 34,472 | 36,264 | 34,455 | 32,703 | 33,845 | 34,757 | 33,516 | 34,118 | 33,652 |
| 2018 | 35,509 | 35,137 | 36,920 | 35,147 | 35,766 | 35,036 | 33,306 | 33,885 | 33,111 | 32,940 | 33,698 | 33,145 |
| 2019 | 33,934 | 34,799 | 32,185 | 33,232 | 36,055 | 34,852 | 35,411 | 33,181 | 31,610 | 33,434 | 34,313 | 33,475 |
| 2020 | 34,244 | 36,386 | 36,922 | 32,858 | 31,590 | 30,593 | 31,006 | 30,643 | 29,402 | 28,774 | 30,022 | 28,716 |
| 2021 | 29,460 | 29,292 | 30,643 | 29,756 | 31,330 | 32,527 | 31,313 | 30,792 | 32,542 | 32,513 | 31,800 | 31,290 |
| 2022 | 31,735 | 31,756 | 34,531 | 31,233 | 34,013 | 33,896 | 31,673 | 31,015 | 30,147 | 31,864 | 33,141 | 33,051 |
| 2023 | 31,994 | 33,165 | 34,386 | 32,685 | 31,533 | 30,967 | 30,915 | 31,301 | 32,716 | 30,757 | 31,183 | 32,208 |
| 2024 | 33,193 | |||||||||||
| - = No Data Reported; -- = Not Applicable; NA = Not Available; W = Withheld to avoid disclosure of individual company data. |
| Release Date: 3/29/2024 |
| Next Release Date: 4/30/2024 |