|
Download Data (XLS File) |
|
||||||||
|
||||||||
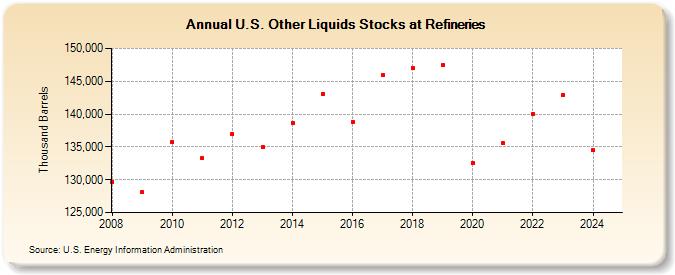
| U.S. Other Liquids Stocks at Refineries (Thousand Barrels) | ||||||||
| Decade | Year-0 | Year-1 | Year-2 | Year-3 | Year-4 | Year-5 | Year-6 | Year-7 | Year-8 | Year-9 |
|---|---|---|---|---|---|---|---|---|---|---|
| 2000's | 129,711 | 128,120 | ||||||||
| 2010's | 135,765 | 133,243 | 136,977 | 134,914 | 138,607 | 143,036 | 138,804 | 145,985 | 147,033 | 147,447 |
| 2020's | 132,606 | 135,528 | 140,053 | 142,989 |
| - = No Data Reported; -- = Not Applicable; NA = Not Available; W = Withheld to avoid disclosure of individual company data. |
| Release Date: 3/29/2024 |
| Next Release Date: 8/30/2024 |