|
Download Data (XLS File) |
|
||||||||
|
||||||||
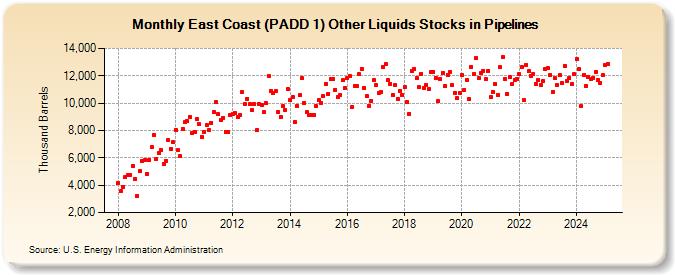
| East Coast (PADD 1) Other Liquids Stocks in Pipelines (Thousand Barrels) | ||||||||
| Year | Jan | Feb | Mar | Apr | May | Jun | Jul | Aug | Sep | Oct | Nov | Dec |
|---|---|---|---|---|---|---|---|---|---|---|---|---|
| 2008 | 4,168 | 3,549 | 3,903 | 4,610 | 4,710 | 4,756 | 5,407 | 4,457 | 3,194 | 5,032 | 5,794 | 5,840 |
| 2009 | 4,849 | 5,862 | 6,769 | 7,674 | 5,899 | 6,364 | 6,538 | 5,568 | 5,791 | 7,294 | 6,682 | 7,125 |
| 2010 | 8,049 | 6,545 | 6,118 | 8,113 | 8,593 | 8,688 | 9,020 | 7,834 | 7,886 | 8,815 | 8,460 | 7,543 |
| 2011 | 7,874 | 8,410 | 8,016 | 8,569 | 9,363 | 10,048 | 9,183 | 8,746 | 8,913 | 7,914 | 7,852 | 9,108 |
| 2012 | 9,232 | 9,270 | 9,002 | 9,110 | 10,783 | 9,962 | 10,333 | 9,926 | 9,483 | 9,919 | 8,002 | 9,906 |
| 2013 | 9,829 | 9,370 | 9,978 | 11,946 | 10,880 | 10,740 | 10,874 | 9,361 | 8,998 | 9,753 | 9,516 | 11,021 |
| 2014 | 10,220 | 10,459 | 8,637 | 9,802 | 10,562 | 11,805 | 10,037 | 9,315 | 9,165 | 9,158 | 9,108 | 9,781 |
| 2015 | 10,206 | 10,020 | 10,512 | 11,431 | 10,696 | 11,775 | 11,750 | 10,987 | 10,466 | 10,590 | 11,666 | 11,107 |
| 2016 | 11,863 | 11,948 | 9,722 | 11,281 | 11,244 | 12,096 | 12,499 | 11,136 | 10,514 | 9,819 | 10,186 | 11,664 |
| 2017 | 11,313 | 10,771 | 10,779 | 12,656 | 12,852 | 11,654 | 11,403 | 10,607 | 11,322 | 10,290 | 10,875 | 10,578 |
| 2018 | 11,158 | 10,065 | 9,229 | 12,345 | 12,501 | 11,842 | 11,154 | 12,145 | 11,106 | 11,334 | 11,025 | 12,269 |
| 2019 | 12,279 | 11,856 | 10,134 | 11,763 | 12,219 | 11,233 | 12,063 | 12,303 | 11,320 | 10,741 | 10,339 | 10,770 |
| 2020 | 12,030 | 10,970 | 11,688 | 10,294 | 12,644 | 12,126 | 13,270 | 11,800 | 12,183 | 12,381 | 11,733 | 12,381 |
| 2021 | 10,432 | 10,842 | 11,388 | 10,616 | 12,620 | 13,368 | 11,779 | 10,701 | 11,907 | 11,388 | 11,689 | 11,795 |
| 2022 | 12,111 | 12,609 | 10,202 | 12,817 | 12,328 | 12,017 | 12,131 | 11,430 | 11,703 | 11,311 | 11,603 | 12,457 |
| 2023 | 12,532 | 12,072 | 10,877 | 11,825 | 11,319 | 12,042 | 11,476 | 12,749 | 11,628 | 11,830 | 11,380 | 12,110 |
| 2024 | 13,219 | |||||||||||
| - = No Data Reported; -- = Not Applicable; NA = Not Available; W = Withheld to avoid disclosure of individual company data. |
| Release Date: 3/29/2024 |
| Next Release Date: 4/30/2024 |