|
Download Data (XLS File) |
|
||||||||
|
||||||||
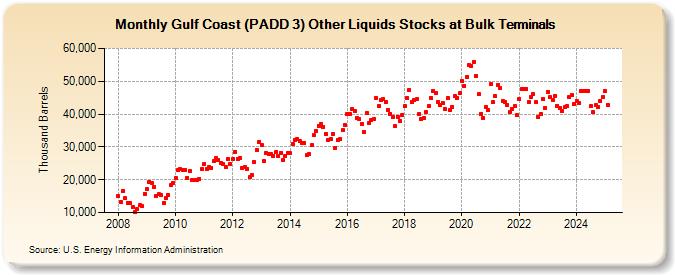
| Gulf Coast (PADD 3) Other Liquids Stocks at Bulk Terminals (Thousand Barrels) | ||||||||
| Year | Jan | Feb | Mar | Apr | May | Jun | Jul | Aug | Sep | Oct | Nov | Dec |
|---|---|---|---|---|---|---|---|---|---|---|---|---|
| 2008 | 14,996 | 13,255 | 16,582 | 14,305 | 13,031 | 12,834 | 11,557 | 10,155 | 10,951 | 12,215 | 11,929 | 15,745 |
| 2009 | 17,191 | 19,408 | 19,082 | 17,815 | 15,035 | 15,514 | 15,274 | 13,049 | 14,389 | 15,479 | 18,360 | 19,033 |
| 2010 | 20,495 | 23,099 | 23,245 | 22,918 | 22,964 | 20,585 | 22,558 | 19,796 | 19,919 | 19,919 | 20,255 | 23,174 |
| 2011 | 24,656 | 23,339 | 23,818 | 23,578 | 25,592 | 26,472 | 26,062 | 25,207 | 24,695 | 23,902 | 26,263 | 24,835 |
| 2012 | 26,278 | 28,558 | 26,278 | 26,692 | 23,696 | 23,820 | 23,310 | 20,737 | 21,500 | 25,465 | 29,090 | 31,601 |
| 2013 | 30,492 | 25,635 | 28,143 | 27,925 | 27,779 | 27,375 | 28,340 | 27,337 | 28,108 | 25,863 | 27,263 | 28,193 |
| 2014 | 28,041 | 30,962 | 32,135 | 32,486 | 31,778 | 31,111 | 31,330 | 27,427 | 27,719 | 30,472 | 33,541 | 34,821 |
| 2015 | 36,454 | 37,023 | 36,060 | 34,029 | 32,113 | 32,427 | 34,008 | 29,774 | 32,207 | 32,272 | 35,041 | 36,669 |
| 2016 | 39,986 | 40,133 | 41,614 | 40,820 | 38,950 | 38,403 | 37,054 | 34,662 | 40,451 | 37,324 | 38,104 | 38,363 |
| 2017 | 45,019 | 42,420 | 44,248 | 44,477 | 43,668 | 41,199 | 40,153 | 39,027 | 36,369 | 39,230 | 37,951 | 39,857 |
| 2018 | 42,447 | 44,899 | 47,289 | 43,627 | 44,244 | 44,460 | 39,955 | 38,608 | 38,875 | 40,537 | 42,334 | 44,933 |
| 2019 | 47,109 | 46,552 | 43,679 | 42,712 | 43,333 | 41,565 | 44,924 | 41,260 | 42,209 | 45,416 | 44,914 | 46,268 |
| 2020 | 50,081 | 48,654 | 51,364 | 54,908 | 54,687 | 55,979 | 51,546 | 46,014 | 40,168 | 38,768 | 42,149 | 41,210 |
| 2021 | 49,065 | 43,587 | 45,467 | 48,879 | 47,916 | 43,906 | 43,601 | 42,794 | 40,588 | 41,602 | 42,318 | 39,597 |
| 2022 | 44,736 | 47,743 | 47,675 | 47,679 | 43,525 | 45,311 | 46,034 | 43,556 | 39,014 | 40,079 | 44,690 | 41,811 |
| 2023 | 46,709 | 44,719 | 43,964 | 45,342 | 42,501 | 41,827 | 41,414 | 42,010 | 42,327 | 45,094 | 47,614 | 43,650 |
| 2024 | 44,049 | |||||||||||
| - = No Data Reported; -- = Not Applicable; NA = Not Available; W = Withheld to avoid disclosure of individual company data. |
| Release Date: 3/29/2024 |
| Next Release Date: 4/30/2024 |