|
Download Data (XLS File) |
|
||||||||
|
||||||||
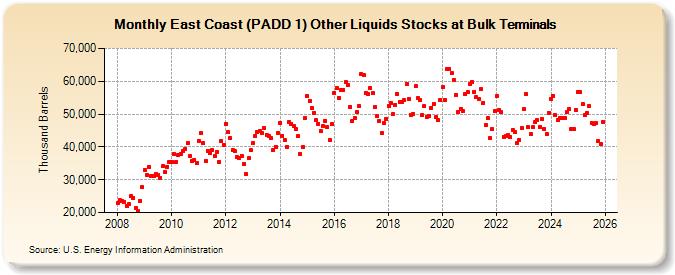
| East Coast (PADD 1) Other Liquids Stocks at Bulk Terminals (Thousand Barrels) | ||||||||
| Year | Jan | Feb | Mar | Apr | May | Jun | Jul | Aug | Sep | Oct | Nov | Dec |
|---|---|---|---|---|---|---|---|---|---|---|---|---|
| 2008 | 22,886 | 23,721 | 23,652 | 23,237 | 22,146 | 22,478 | 24,950 | 24,501 | 21,403 | 20,365 | 23,606 | 27,758 |
| 2009 | 32,991 | 31,471 | 34,027 | 31,024 | 31,174 | 31,719 | 31,451 | 30,569 | 34,098 | 32,380 | 34,011 | 35,375 |
| 2010 | 35,398 | 37,799 | 35,491 | 37,487 | 37,983 | 38,743 | 39,284 | 41,200 | 37,292 | 35,781 | 36,085 | 35,092 |
| 2011 | 41,924 | 44,208 | 41,129 | 35,748 | 38,879 | 38,185 | 38,922 | 37,110 | 38,540 | 35,396 | 41,656 | 40,697 |
| 2012 | 47,094 | 44,421 | 42,692 | 39,021 | 38,691 | 36,819 | 36,541 | 37,345 | 34,732 | 31,706 | 36,516 | 38,911 |
| 2013 | 41,155 | 43,243 | 44,650 | 44,870 | 44,157 | 45,622 | 43,705 | 43,222 | 42,644 | 39,052 | 40,086 | 44,284 |
| 2014 | 47,342 | 43,433 | 42,072 | 40,111 | 47,586 | 47,124 | 46,230 | 45,438 | 43,199 | 37,888 | 39,958 | 48,873 |
| 2015 | 55,476 | 53,946 | 51,816 | 50,463 | 48,059 | 47,094 | 44,827 | 46,294 | 47,895 | 46,004 | 42,188 | 46,963 |
| 2016 | 56,494 | 57,890 | 55,016 | 57,323 | 57,367 | 59,748 | 58,756 | 52,233 | 47,872 | 48,865 | 50,663 | 52,430 |
| 2017 | 62,049 | 61,866 | 56,508 | 56,166 | 58,010 | 56,395 | 52,131 | 49,362 | 47,943 | 44,135 | 47,349 | 48,595 |
| 2018 | 52,532 | 53,336 | 49,903 | 52,904 | 56,123 | 53,693 | 53,561 | 54,139 | 59,295 | 54,580 | 49,844 | 50,047 |
| 2019 | 58,417 | 54,754 | 54,270 | 49,667 | 52,347 | 49,130 | 49,544 | 51,984 | 53,087 | 49,083 | 48,186 | 54,422 |
| 2020 | 58,104 | 54,317 | 63,783 | 63,817 | 62,474 | 60,427 | 55,909 | 50,733 | 51,583 | 50,795 | 56,033 | 56,760 |
| 2021 | 59,008 | 59,832 | 56,726 | 55,066 | 54,708 | 57,580 | 53,458 | 46,654 | 48,652 | 42,659 | 45,505 | 50,948 |
| 2022 | 55,631 | 51,359 | 50,535 | 43,127 | 43,389 | 43,549 | 43,070 | 45,194 | 44,421 | 41,150 | 42,086 | 45,788 |
| 2023 | 51,173 | 55,784 | 45,796 | 43,641 | 45,650 | 47,710 | 47,966 | 46,064 | 48,505 | 45,253 | 43,780 | 50,415 |
| 2024 | 55,058 | 55,121 | ||||||||||
| - = No Data Reported; -- = Not Applicable; NA = Not Available; W = Withheld to avoid disclosure of individual company data. |
| Release Date: 4/30/2024 |
| Next Release Date: 5/31/2024 |