|
Download Data (XLS File) |
|
||||||||
|
||||||||
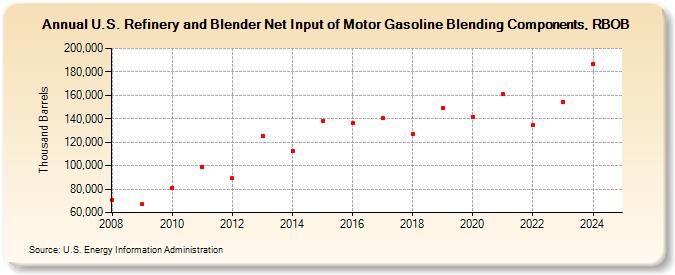
| U.S. Refinery and Blender Net Input of Motor Gasoline Blending Components, RBOB (Thousand Barrels) | ||||||||
| Decade | Year-0 | Year-1 | Year-2 | Year-3 | Year-4 | Year-5 | Year-6 | Year-7 | Year-8 | Year-9 |
|---|---|---|---|---|---|---|---|---|---|---|
| 2000's | 70,988 | 66,985 | ||||||||
| 2010's | 81,206 | 98,741 | 89,160 | 125,530 | 112,515 | 137,767 | 136,004 | 140,697 | 126,742 | 149,146 |
| 2020's | 141,863 | 161,085 | 134,954 | 154,270 |
| - = No Data Reported; -- = Not Applicable; NA = Not Available; W = Withheld to avoid disclosure of individual company data. |
| Release Date: 3/29/2024 |
| Next Release Date: 8/30/2024 |