|
Download Data (XLS File) |
|
||||||||
|
||||||||
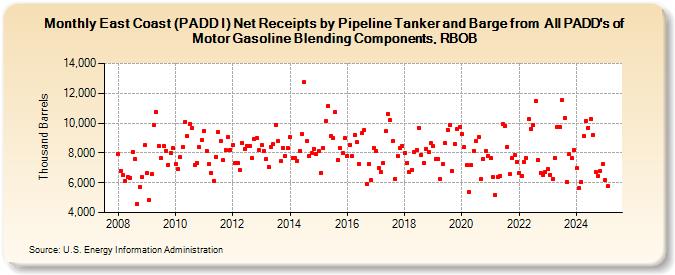
| East Coast (PADD I) Net Receipts by Pipeline Tanker and Barge from All PADD's of Motor Gasoline Blending Components, RBOB (Thousand Barrels) | ||||||||
| Year | Jan | Feb | Mar | Apr | May | Jun | Jul | Aug | Sep | Oct | Nov | Dec |
|---|---|---|---|---|---|---|---|---|---|---|---|---|
| 2008 | 7,934 | 6,817 | 6,508 | 6,127 | 6,407 | 6,349 | 8,073 | 7,590 | 4,574 | 5,741 | 6,376 | 8,502 |
| 2009 | 6,687 | 4,833 | 6,565 | 9,845 | 10,755 | 8,454 | 7,656 | 8,459 | 8,161 | 7,218 | 8,026 | 8,304 |
| 2010 | 7,266 | 6,922 | 7,697 | 8,375 | 10,078 | 9,118 | 9,939 | 9,656 | 7,187 | 7,324 | 8,376 | 8,869 |
| 2011 | 9,498 | 8,153 | 7,257 | 6,676 | 6,128 | 7,757 | 9,435 | 8,772 | 7,500 | 8,181 | 9,057 | 8,214 |
| 2012 | 8,529 | 7,338 | 7,311 | 6,844 | 8,695 | 8,267 | 8,488 | 8,449 | 7,669 | 8,928 | 8,987 | 8,196 |
| 2013 | 8,508 | 8,119 | 7,584 | 7,072 | 8,423 | 8,578 | 9,906 | 8,779 | 7,428 | 8,361 | 7,767 | 8,310 |
| 2014 | 9,055 | 7,670 | 7,676 | 7,469 | 8,117 | 9,279 | 12,741 | 8,776 | 7,787 | 8,001 | 8,288 | 7,928 |
| 2015 | 8,098 | 6,685 | 8,318 | 10,157 | 11,149 | 9,112 | 8,973 | 10,729 | 7,529 | 8,330 | 7,992 | 8,987 |
| 2016 | 7,815 | 8,563 | 7,767 | 9,210 | 8,711 | 7,286 | 9,304 | 9,524 | 5,884 | 7,251 | 6,155 | 8,360 |
| 2017 | 8,116 | 7,005 | 6,721 | 7,317 | 9,439 | 10,597 | 10,181 | 8,771 | 6,266 | 7,825 | 8,328 | 8,460 |
| 2018 | 7,993 | 7,336 | 6,715 | 6,875 | 8,076 | 8,226 | 9,674 | 7,880 | 7,311 | 8,286 | 8,053 | 8,638 |
| 2019 | 8,444 | 7,574 | 7,591 | 6,242 | 7,224 | 8,636 | 9,571 | 9,906 | 6,804 | 8,602 | 9,603 | 9,717 |
| 2020 | 9,270 | 8,368 | 7,170 | 5,393 | 7,180 | 8,135 | 8,777 | 9,058 | 6,221 | 7,582 | 8,113 | 7,805 |
| 2021 | 7,674 | 6,363 | 5,165 | 6,389 | 6,466 | 9,908 | 9,796 | 8,430 | 6,555 | 7,674 | 7,831 | 7,416 |
| 2022 | 6,648 | 6,440 | 7,394 | 7,682 | 10,272 | 9,615 | 9,871 | 11,497 | 7,553 | 6,656 | 6,523 | 6,696 |
| 2023 | 6,894 | 6,520 | 6,235 | 7,691 | 9,759 | 9,711 | 11,533 | 10,330 | 6,067 | 7,908 | 7,631 | 8,181 |
| 2024 | 6,964 | |||||||||||
| - = No Data Reported; -- = Not Applicable; NA = Not Available; W = Withheld to avoid disclosure of individual company data. |
| Release Date: 3/29/2024 |
| Next Release Date: 4/30/2024 |
Referring Pages: