|
Download Data (XLS File) |
|
||||||||
|
||||||||
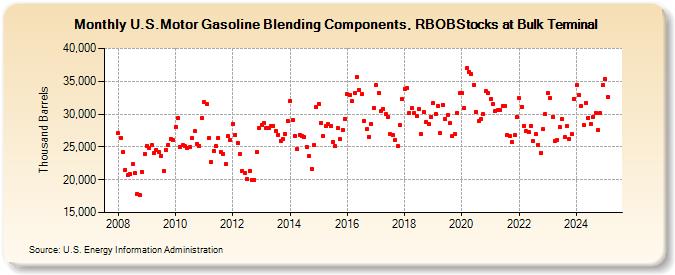
| U.S.Motor Gasoline Blending Components, RBOBStocks at Bulk Terminal (Thousand Barrels) | ||||||||
| Year | Jan | Feb | Mar | Apr | May | Jun | Jul | Aug | Sep | Oct | Nov | Dec |
|---|---|---|---|---|---|---|---|---|---|---|---|---|
| 2008 | 27,040 | 26,382 | 24,208 | 21,545 | 20,708 | 20,857 | 22,334 | 20,951 | 17,898 | 17,667 | 21,218 | 23,923 |
| 2009 | 25,145 | 24,882 | 25,260 | 24,045 | 24,574 | 24,225 | 23,685 | 21,400 | 24,573 | 25,355 | 26,234 | 26,005 |
| 2010 | 27,958 | 29,327 | 25,032 | 25,275 | 25,096 | 24,771 | 25,030 | 26,325 | 27,363 | 25,506 | 25,136 | 29,461 |
| 2011 | 31,819 | 31,549 | 26,329 | 22,754 | 24,418 | 25,136 | 26,393 | 24,247 | 23,982 | 22,352 | 26,599 | 25,995 |
| 2012 | 28,451 | 26,886 | 25,643 | 23,968 | 21,402 | 21,077 | 20,101 | 21,339 | 19,965 | 20,013 | 24,228 | 27,859 |
| 2013 | 28,396 | 28,658 | 27,906 | 27,915 | 28,226 | 28,207 | 27,495 | 26,873 | 25,937 | 26,128 | 26,992 | 28,952 |
| 2014 | 31,968 | 29,151 | 26,709 | 24,628 | 26,887 | 26,677 | 26,460 | 24,997 | 23,585 | 21,704 | 25,315 | 31,022 |
| 2015 | 31,575 | 28,659 | 26,630 | 28,165 | 28,452 | 28,163 | 25,708 | 25,081 | 27,907 | 26,184 | 27,578 | 29,251 |
| 2016 | 33,015 | 32,973 | 31,942 | 33,212 | 35,610 | 33,718 | 32,984 | 29,008 | 27,674 | 26,552 | 28,514 | 30,948 |
| 2017 | 34,440 | 33,253 | 30,414 | 30,784 | 29,965 | 29,519 | 26,905 | 26,753 | 26,051 | 25,070 | 28,280 | 32,296 |
| 2018 | 33,843 | 33,998 | 30,236 | 30,889 | 30,178 | 29,740 | 30,715 | 26,912 | 30,324 | 28,821 | 28,502 | 29,627 |
| 2019 | 31,676 | 30,065 | 31,269 | 27,065 | 31,438 | 29,266 | 29,840 | 28,566 | 26,664 | 26,986 | 30,173 | 33,149 |
| 2020 | 33,171 | 30,865 | 36,952 | 36,417 | 36,074 | 34,467 | 30,354 | 28,930 | 29,185 | 30,038 | 33,468 | 33,259 |
| 2021 | 32,362 | 31,504 | 30,444 | 30,565 | 30,576 | 31,188 | 31,220 | 26,775 | 26,604 | 25,774 | 26,760 | 29,592 |
| 2022 | 32,398 | 31,119 | 28,251 | 27,360 | 27,227 | 28,165 | 25,896 | 26,910 | 25,333 | 24,113 | 27,667 | 29,997 |
| 2023 | 32,935 | 32,391 | 29,567 | 25,832 | 25,982 | 27,968 | 29,968 | 26,461 | 28,152 | 26,273 | 26,911 | 32,825 |
| 2024 | 34,361 | |||||||||||
| - = No Data Reported; -- = Not Applicable; NA = Not Available; W = Withheld to avoid disclosure of individual company data. |
| Release Date: 3/29/2024 |
| Next Release Date: 4/30/2024 |