|
Download Data (XLS File) |
|
||||||||
|
||||||||
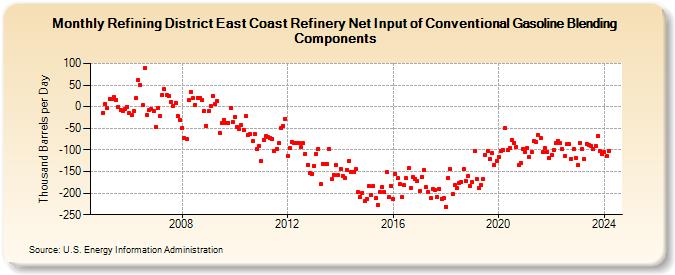
| Refining District East Coast Refinery Net Input of Conventional Gasoline Blending Components (Thousand Barrels per Day) | ||||||||
| Year | Jan | Feb | Mar | Apr | May | Jun | Jul | Aug | Sep | Oct | Nov | Dec |
|---|---|---|---|---|---|---|---|---|---|---|---|---|
| 2005 | -14 | 6 | -4 | 18 | 17 | 23 | 16 | 0 | -8 | -10 | -6 | 0 |
| 2006 | -15 | -20 | -10 | 19 | 62 | 50 | 3 | 89 | -19 | -8 | -6 | -11 |
| 2007 | -47 | -2 | -22 | 28 | 40 | 26 | 25 | 12 | 2 | 9 | -22 | -31 |
| 2008 | -49 | -73 | -74 | 15 | 34 | 19 | 4 | 21 | 21 | 15 | -11 | -44 |
| 2009 | -11 | 1 | 25 | 7 | 13 | -60 | -38 | -30 | -37 | -37 | -3 | -35 |
| 2010 | -23 | -46 | -52 | -43 | -53 | -22 | -66 | -64 | -79 | -63 | -99 | -91 |
| 2011 | -126 | -77 | -68 | -70 | -73 | -75 | -103 | -97 | -85 | -50 | -44 | -29 |
| 2012 | -114 | -96 | -81 | -84 | -85 | -83 | -93 | -85 | -109 | -134 | -153 | -155 |
| 2013 | -137 | -109 | -97 | -180 | -132 | -133 | -132 | -99 | -168 | -158 | -135 | -159 |
| 2014 | -144 | -160 | -166 | -147 | -125 | -151 | -150 | -145 | -198 | -208 | -199 | -218 |
| 2015 | -213 | -184 | -205 | -184 | -212 | -227 | -197 | -187 | -198 | -152 | -210 | -184 |
| 2016 | -214 | -156 | -166 | -180 | -210 | -182 | -166 | -142 | -188 | -163 | -167 | -173 |
| 2017 | -196 | -162 | -147 | -187 | -198 | -212 | -190 | -193 | -209 | -190 | -213 | -212 |
| 2018 | -231 | -164 | -144 | -203 | -182 | -189 | -176 | -174 | -145 | -172 | -161 | -184 |
| 2019 | -175 | -102 | -167 | -189 | -182 | -168 | -111 | -102 | -122 | -107 | -135 | -125 |
| 2020 | -117 | -102 | -100 | -50 | -101 | -96 | -76 | -84 | -93 | -136 | -130 | -97 |
| 2021 | -104 | -96 | -116 | -105 | -80 | -81 | -66 | -73 | -105 | -96 | -105 | -119 |
| 2022 | -112 | -100 | -85 | -79 | -85 | -98 | -114 | -86 | -87 | -121 | -99 | -118 |
| 2023 | -136 | -83 | -97 | -122 | -86 | -88 | -91 | -97 | -91 | -67 | -103 | -110 |
| 2024 | -105 | -115 | ||||||||||
| - = No Data Reported; -- = Not Applicable; NA = Not Available; W = Withheld to avoid disclosure of individual company data. |
| Release Date: 4/30/2024 |
| Next Release Date: 5/31/2024 |