|
Download Data (XLS File) |
|
||||||||
|
||||||||
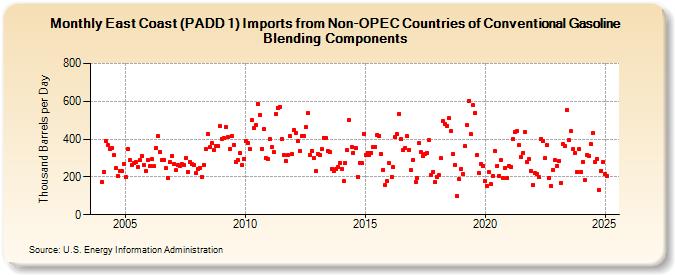
| East Coast (PADD 1) Imports from Non-OPEC Countries of Conventional Gasoline Blending Components (Thousand Barrels per Day) | ||||||||
| Year | Jan | Feb | Mar | Apr | May | Jun | Jul | Aug | Sep | Oct | Nov | Dec |
|---|---|---|---|---|---|---|---|---|---|---|---|---|
| 2004 | 174 | 228 | 391 | 367 | 349 | 351 | 315 | 245 | 207 | 229 | 231 | 269 |
| 2005 | 197 | 346 | 288 | 264 | 272 | 280 | 255 | 288 | 310 | 263 | 230 | 291 |
| 2006 | 260 | 293 | 256 | 354 | 416 | 333 | 289 | 291 | 246 | 195 | 278 | 310 |
| 2007 | 270 | 235 | 262 | 260 | 267 | 265 | 301 | 225 | 281 | 268 | 262 | 219 |
| 2008 | 243 | 249 | 201 | 264 | 345 | 427 | 356 | 380 | 341 | 365 | 363 | 467 |
| 2009 | 401 | 405 | 463 | 411 | 347 | 416 | 371 | 279 | 290 | 326 | 263 | 295 |
| 2010 | 390 | 381 | 347 | 499 | 457 | 474 | 588 | 529 | 350 | 451 | 301 | 296 |
| 2011 | 401 | 356 | 332 | 531 | 567 | 572 | 401 | 315 | 285 | 314 | 415 | 321 |
| 2012 | 449 | 434 | 388 | 338 | 418 | 414 | 462 | 538 | 316 | 338 | 300 | 230 |
| 2013 | 320 | 314 | 345 | 408 | 405 | 338 | 331 | 243 | 230 | 240 | 253 | 271 |
| 2014 | 244 | 177 | 274 | 342 | 502 | 359 | 329 | 353 | 201 | 275 | 272 | 429 |
| 2015 | 317 | 328 | 314 | 328 | 360 | 360 | 423 | 418 | 320 | 238 | 157 | 176 |
| 2016 | 271 | 202 | 250 | 409 | 425 | 533 | 399 | 340 | 353 | 414 | 344 | 234 |
| 2017 | 291 | 174 | 193 | 377 | 330 | 313 | 322 | 327 | 393 | 211 | 228 | 173 |
| 2018 | 202 | 208 | 298 | 494 | 481 | 470 | 509 | 443 | 321 | 263 | 97 | 187 |
| 2019 | 241 | 215 | 362 | 472 | 602 | 425 | 578 | 538 | 317 | 219 | 268 | 259 |
| 2020 | 177 | 152 | 224 | 161 | 205 | 337 | 258 | 205 | 287 | 193 | 249 | 193 |
| 2021 | 259 | 253 | 398 | 437 | 442 | 368 | 305 | 329 | 439 | 281 | 295 | 229 |
| 2022 | 157 | 219 | 213 | 197 | 398 | 390 | 300 | 367 | 196 | 153 | 239 | 288 |
| 2023 | 260 | 285 | 170 | 372 | 363 | 555 | 393 | 441 | 347 | 326 | 227 | 346 |
| 2024 | 226 | |||||||||||
| - = No Data Reported; -- = Not Applicable; NA = Not Available; W = Withheld to avoid disclosure of individual company data. |
| Release Date: 3/29/2024 |
| Next Release Date: 4/30/2024 |