|
Download Data (XLS File) |
|
||||||||
|
||||||||
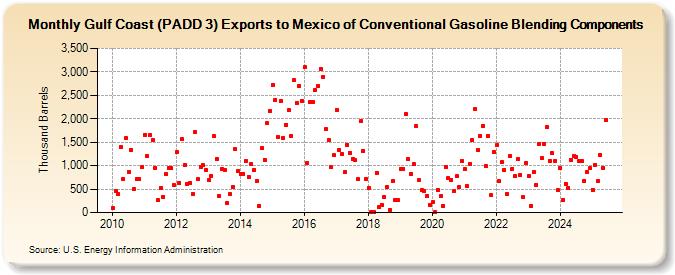
| Gulf Coast (PADD 3) Exports to Mexico of Conventional Gasoline Blending Components (Thousand Barrels) | ||||||||
| Year | Jan | Feb | Mar | Apr | May | Jun | Jul | Aug | Sep | Oct | Nov | Dec |
|---|---|---|---|---|---|---|---|---|---|---|---|---|
| 2010 | 105 | 452 | 403 | 1,399 | 719 | 1,580 | 868 | 1,333 | 500 | 712 | 711 | 963 |
| 2011 | 1,662 | 1,197 | 1,655 | 1,547 | 957 | 260 | 531 | 338 | 817 | 951 | 947 | 585 |
| 2012 | 1,289 | 628 | 1,559 | 1,009 | 609 | 635 | 397 | 1,707 | 706 | 980 | 1,007 | 908 |
| 2013 | 687 | 784 | 1,625 | 1,142 | 363 | 939 | 913 | 208 | 392 | 550 | 1,347 | 885 |
| 2014 | 820 | 818 | 1,095 | 766 | 1,025 | 916 | 678 | 140 | 1,376 | 1,127 | 1,902 | 2,168 |
| 2015 | 2,721 | 2,401 | 1,616 | 2,378 | 1,589 | 1,877 | 2,180 | 1,636 | 2,817 | 2,340 | 2,699 | 2,383 |
| 2016 | 3,093 | 1,057 | 2,347 | 2,365 | 2,609 | 2,703 | 3,066 | 2,891 | 1,774 | 1,550 | 965 | 1,219 |
| 2017 | 2,194 | 1,340 | 1,259 | 857 | 1,446 | 1,280 | 1,149 | 1,113 | 708 | 1,942 | 1,309 | 720 |
| 2018 | 531 | 2 | 3 | 849 | 114 | 169 | 329 | 544 | 64 | 667 | 278 | 275 |
| 2019 | 930 | 931 | 2,101 | 1,134 | 820 | 1,028 | 1,839 | 687 | 477 | 454 | 357 | 160 |
| 2020 | 215 | 6 | 488 | 349 | 148 | 981 | 731 | 696 | 453 | 770 | 544 | 1,108 |
| 2021 | 930 | 556 | 1,041 | 1,546 | 2,198 | 1,342 | 1,638 | 1,846 | 997 | 1,627 | 366 | 1,293 |
| 2022 | 1,432 | 667 | 1,071 | 915 | 395 | 1,202 | 939 | 769 | 1,137 | 809 | 323 | 1,053 |
| 2023 | 703 | 83 | 816 | 441 | 1,380 | 1,151 | 1,450 | 1,817 | 1,106 | 1,258 | 1,107 | 460 |
| 2024 | 1,215 | |||||||||||
| - = No Data Reported; -- = Not Applicable; NA = Not Available; W = Withheld to avoid disclosure of individual company data. |
| Release Date: 3/29/2024 |
| Next Release Date: 4/30/2024 |