|
Download Data (XLS File) |
|
||||||||
|
||||||||
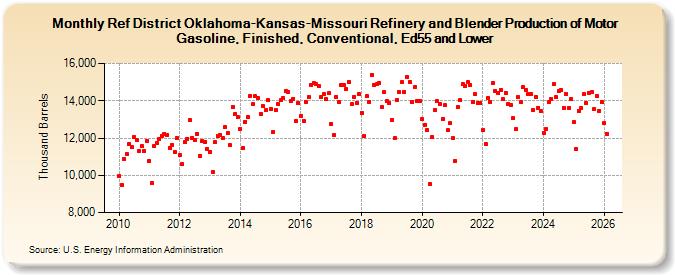
| Ref District Oklahoma-Kansas-Missouri Refinery and Blender Production of Motor Gasoline, Finished, Conventional, Ed55 and Lower (Thousand Barrels) | ||||||||
| Year | Jan | Feb | Mar | Apr | May | Jun | Jul | Aug | Sep | Oct | Nov | Dec |
|---|---|---|---|---|---|---|---|---|---|---|---|---|
| 2010 | 9,961 | 9,479 | 10,896 | 11,132 | 11,688 | 11,510 | 12,061 | 11,868 | 11,326 | 11,561 | 11,285 | 11,859 |
| 2011 | 10,773 | 9,581 | 11,565 | 11,722 | 11,938 | 12,116 | 12,216 | 12,176 | 11,472 | 11,648 | 11,268 | 12,006 |
| 2012 | 11,096 | 10,599 | 11,788 | 11,974 | 12,977 | 12,023 | 11,901 | 12,234 | 11,054 | 11,850 | 11,813 | 11,410 |
| 2013 | 11,253 | 10,190 | 11,768 | 12,123 | 12,172 | 12,012 | 12,579 | 12,290 | 11,623 | 13,672 | 13,307 | 13,103 |
| 2014 | 12,486 | 11,470 | 12,881 | 13,108 | 14,277 | 13,802 | 14,238 | 14,135 | 13,308 | 13,708 | 13,482 | 14,033 |
| 2015 | 13,535 | 12,302 | 13,502 | 13,826 | 14,015 | 14,130 | 14,537 | 14,482 | 13,963 | 14,109 | 12,917 | 13,889 |
| 2016 | 13,201 | 12,900 | 13,940 | 14,200 | 14,848 | 14,964 | 14,891 | 14,786 | 14,199 | 14,349 | 14,082 | 14,415 |
| 2017 | 12,754 | 12,153 | 14,225 | 13,927 | 14,839 | 14,832 | 14,628 | 15,021 | 13,812 | 14,228 | 13,888 | 14,351 |
| 2018 | 13,360 | 12,108 | 14,235 | 13,952 | 15,398 | 14,857 | 14,894 | 14,971 | 13,670 | 14,445 | 13,996 | 13,887 |
| 2019 | 12,970 | 11,992 | 14,045 | 14,468 | 14,982 | 14,457 | 15,263 | 15,001 | 13,918 | 14,723 | 13,985 | 14,010 |
| 2020 | 13,006 | 12,723 | 12,433 | 9,533 | 12,062 | 13,506 | 13,965 | 13,848 | 13,046 | 13,746 | 12,414 | 12,791 |
| 2021 | 11,997 | 10,792 | 13,672 | 14,032 | 14,884 | 14,788 | 14,983 | 14,855 | 13,955 | 14,346 | 13,874 | 13,879 |
| 2022 | 12,411 | 11,685 | 14,147 | 13,939 | 14,967 | 14,546 | 14,392 | 14,601 | 14,079 | 14,428 | 13,844 | 13,784 |
| 2023 | 13,049 | 12,466 | 14,209 | 13,923 | 14,716 | 14,603 | 14,359 | 14,369 | 13,478 | 14,209 | 13,630 | 13,428 |
| 2024 | 12,276 | 12,488 | 13,908 | 14,082 | ||||||||
| - = No Data Reported; -- = Not Applicable; NA = Not Available; W = Withheld to avoid disclosure of individual company data. |
| Release Date: 6/28/2024 |
| Next Release Date: 7/31/2024 |