|
Download Data (XLS File) |
|
||||||||
|
||||||||
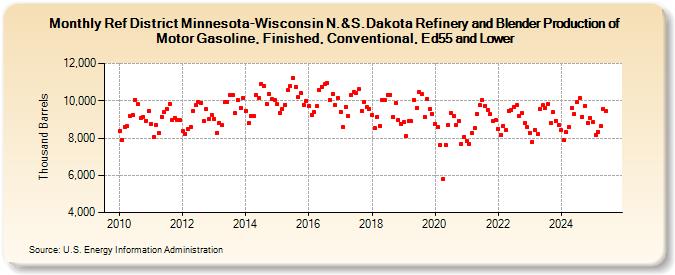
| Ref District Minnesota-Wisconsin N.&S.Dakota Refinery and Blender Production of Motor Gasoline, Finished, Conventional, Ed55 and Lower (Thousand Barrels) | ||||||||
| Year | Jan | Feb | Mar | Apr | May | Jun | Jul | Aug | Sep | Oct | Nov | Dec |
|---|---|---|---|---|---|---|---|---|---|---|---|---|
| 2010 | 8,384 | 7,915 | 8,614 | 8,624 | 9,208 | 9,248 | 10,060 | 9,806 | 9,059 | 9,136 | 8,937 | 9,438 |
| 2011 | 8,753 | 8,050 | 8,688 | 8,272 | 9,151 | 9,400 | 9,583 | 9,851 | 8,971 | 9,089 | 8,955 | 8,941 |
| 2012 | 8,362 | 8,223 | 8,481 | 8,601 | 9,470 | 9,756 | 9,934 | 9,906 | 8,912 | 9,539 | 9,009 | 9,243 |
| 2013 | 9,008 | 8,286 | 8,826 | 8,673 | 9,913 | 9,957 | 10,291 | 10,284 | 9,318 | 10,030 | 9,618 | 10,149 |
| 2014 | 9,457 | 8,789 | 9,185 | 9,159 | 10,288 | 10,158 | 10,903 | 10,770 | 9,836 | 10,356 | 10,075 | 10,060 |
| 2015 | 9,801 | 9,342 | 9,567 | 9,791 | 10,551 | 10,787 | 11,241 | 10,761 | 10,179 | 10,402 | 9,774 | 10,003 |
| 2016 | 9,723 | 9,250 | 9,400 | 9,699 | 10,556 | 10,753 | 10,877 | 10,952 | 10,030 | 10,366 | 9,785 | 10,143 |
| 2017 | 9,412 | 8,580 | 9,684 | 9,161 | 10,285 | 10,479 | 10,422 | 10,613 | 9,472 | 9,933 | 9,664 | 9,561 |
| 2018 | 9,242 | 8,531 | 9,152 | 8,640 | 10,016 | 10,020 | 10,322 | 10,331 | 9,131 | 9,859 | 8,978 | 8,776 |
| 2019 | 8,854 | 8,103 | 8,897 | 8,899 | 10,045 | 9,628 | 10,474 | 10,342 | 9,148 | 10,099 | 9,549 | 9,277 |
| 2020 | 8,768 | 8,591 | 7,624 | 5,823 | 7,637 | 8,676 | 9,368 | 9,206 | 8,698 | 8,917 | 7,695 | 8,079 |
| 2021 | 7,848 | 7,667 | 8,265 | 8,511 | 9,299 | 9,751 | 10,029 | 9,722 | 9,518 | 9,270 | 8,916 | 8,952 |
| 2022 | 8,498 | 8,183 | 8,654 | 8,410 | 9,465 | 9,498 | 9,679 | 9,748 | 9,179 | 9,336 | 8,815 | 8,578 |
| 2023 | 8,295 | 7,794 | 8,451 | 8,215 | 9,568 | 9,749 | 9,631 | 9,818 | 8,792 | 9,377 | 8,935 | 8,659 |
| 2024 | 8,414 | |||||||||||
| - = No Data Reported; -- = Not Applicable; NA = Not Available; W = Withheld to avoid disclosure of individual company data. |
| Release Date: 3/29/2024 |
| Next Release Date: 4/30/2024 |