|
Download Data (XLS File) |
|
||||||||
|
||||||||
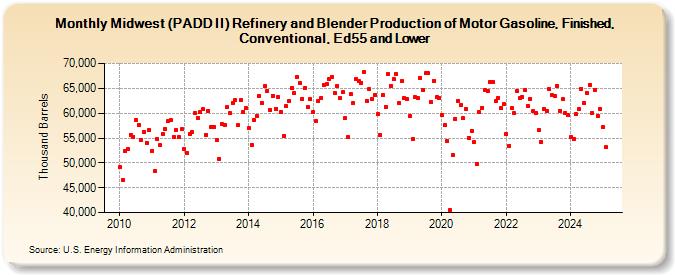
| Midwest (PADD II) Refinery and Blender Production of Motor Gasoline, Finished, Conventional, Ed55 and Lower (Thousand Barrels) | ||||||||
| Year | Jan | Feb | Mar | Apr | May | Jun | Jul | Aug | Sep | Oct | Nov | Dec |
|---|---|---|---|---|---|---|---|---|---|---|---|---|
| 2010 | 49,107 | 46,604 | 52,360 | 52,749 | 55,682 | 55,275 | 58,565 | 57,630 | 54,561 | 56,285 | 54,081 | 56,637 |
| 2011 | 52,447 | 48,433 | 54,770 | 53,503 | 55,908 | 56,843 | 58,410 | 58,657 | 55,217 | 56,608 | 55,177 | 56,762 |
| 2012 | 52,768 | 52,076 | 55,731 | 56,127 | 60,018 | 59,062 | 60,308 | 60,748 | 55,661 | 60,460 | 57,233 | 57,305 |
| 2013 | 54,642 | 50,839 | 57,905 | 57,564 | 61,198 | 59,942 | 62,069 | 62,649 | 57,529 | 62,612 | 60,321 | 60,967 |
| 2014 | 56,993 | 53,694 | 58,618 | 59,382 | 63,540 | 62,022 | 65,435 | 64,494 | 60,708 | 63,510 | 60,842 | 63,297 |
| 2015 | 60,320 | 55,478 | 61,358 | 62,361 | 65,144 | 64,100 | 67,194 | 65,977 | 62,928 | 65,151 | 61,143 | 62,842 |
| 2016 | 60,164 | 58,360 | 62,514 | 63,101 | 65,732 | 65,864 | 66,912 | 67,337 | 64,045 | 65,431 | 63,000 | 64,240 |
| 2017 | 58,999 | 55,115 | 63,792 | 61,949 | 66,803 | 66,443 | 66,136 | 68,319 | 62,518 | 64,830 | 62,802 | 63,712 |
| 2018 | 59,809 | 55,676 | 63,654 | 61,335 | 67,798 | 65,566 | 66,875 | 67,803 | 62,030 | 66,477 | 63,020 | 62,890 |
| 2019 | 59,386 | 54,842 | 63,224 | 63,038 | 67,161 | 64,746 | 67,987 | 67,987 | 62,266 | 66,575 | 63,171 | 63,056 |
| 2020 | 59,726 | 57,537 | 54,391 | 40,449 | 51,622 | 58,920 | 62,539 | 61,584 | 58,937 | 60,863 | 55,089 | 56,491 |
| 2021 | 54,275 | 49,802 | 60,146 | 61,139 | 64,689 | 64,408 | 66,341 | 66,187 | 62,411 | 63,142 | 60,978 | 61,787 |
| 2022 | 55,785 | 53,490 | 60,992 | 59,950 | 64,530 | 63,018 | 63,274 | 64,663 | 61,520 | 62,913 | 60,390 | 60,026 |
| 2023 | 56,520 | 54,172 | 60,873 | 60,345 | 64,899 | 63,576 | 63,475 | 65,476 | 60,549 | 62,842 | 60,040 | 59,612 |
| 2024 | 55,118 | 54,781 | 59,752 | 60,842 | ||||||||
| - = No Data Reported; -- = Not Applicable; NA = Not Available; W = Withheld to avoid disclosure of individual company data. |
| Release Date: 6/28/2024 |
| Next Release Date: 7/31/2024 |