|
Download Data (XLS File) |
|
||||||||
|
||||||||
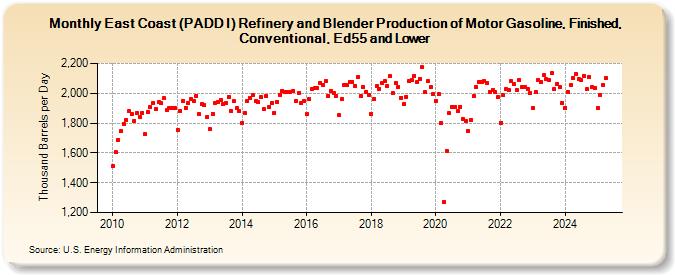
| East Coast (PADD I) Refinery and Blender Production of Motor Gasoline, Finished, Conventional, Ed55 and Lower (Thousand Barrels per Day) | ||||||||
| Year | Jan | Feb | Mar | Apr | May | Jun | Jul | Aug | Sep | Oct | Nov | Dec |
|---|---|---|---|---|---|---|---|---|---|---|---|---|
| 2010 | 1,509 | 1,606 | 1,689 | 1,747 | 1,795 | 1,821 | 1,878 | 1,858 | 1,816 | 1,868 | 1,844 | 1,871 |
| 2011 | 1,725 | 1,873 | 1,905 | 1,937 | 1,893 | 1,943 | 1,933 | 1,966 | 1,885 | 1,902 | 1,899 | 1,904 |
| 2012 | 1,757 | 1,884 | 1,947 | 1,904 | 1,936 | 1,962 | 1,949 | 1,983 | 1,858 | 1,928 | 1,921 | 1,842 |
| 2013 | 1,758 | 1,864 | 1,938 | 1,943 | 1,956 | 1,926 | 1,932 | 1,976 | 1,879 | 1,946 | 1,899 | 1,878 |
| 2014 | 1,802 | 1,867 | 1,950 | 1,968 | 1,987 | 1,948 | 1,943 | 1,972 | 1,892 | 1,982 | 1,911 | 1,936 |
| 2015 | 1,871 | 1,944 | 1,991 | 2,018 | 2,009 | 2,010 | 2,012 | 2,016 | 1,949 | 2,003 | 1,932 | 1,947 |
| 2016 | 1,858 | 1,962 | 2,031 | 2,033 | 2,034 | 2,071 | 2,058 | 2,084 | 1,982 | 2,013 | 2,002 | 1,985 |
| 2017 | 1,852 | 1,961 | 2,057 | 2,055 | 2,076 | 2,079 | 2,050 | 2,109 | 1,983 | 2,042 | 2,011 | 1,990 |
| 2018 | 1,863 | 1,964 | 2,047 | 2,032 | 2,067 | 2,082 | 2,050 | 2,115 | 2,000 | 2,066 | 2,043 | 1,971 |
| 2019 | 1,926 | 1,977 | 2,080 | 2,089 | 2,118 | 2,074 | 2,095 | 2,174 | 2,007 | 2,080 | 2,044 | 1,994 |
| 2020 | 1,948 | 1,993 | 1,800 | 1,274 | 1,615 | 1,866 | 1,909 | 1,905 | 1,879 | 1,911 | 1,829 | 1,816 |
| 2021 | 1,749 | 1,823 | 1,980 | 2,042 | 2,076 | 2,075 | 2,081 | 2,069 | 2,010 | 2,021 | 2,006 | 1,973 |
| 2022 | 1,804 | 1,986 | 2,026 | 2,023 | 2,083 | 2,060 | 2,020 | 2,090 | 2,041 | 2,044 | 2,032 | 2,001 |
| 2023 | 1,902 | 2,009 | 2,089 | 2,075 | 2,121 | 2,093 | 2,088 | 2,133 | 2,026 | 2,065 | 2,040 | 1,936 |
| 2024 | 1,904 | 2,010 | 2,053 | 2,101 | 2,132 | 2,094 | 2,088 | 2,117 | 2,027 | 2,110 | 2,042 | 2,034 |
| 2025 | 1,902 | 1,988 | 2,056 | 2,101 | ||||||||
| - = No Data Reported; -- = Not Applicable; NA = Not Available; W = Withheld to avoid disclosure of individual company data. |
| Release Date: 6/30/2025 |
| Next Release Date: 7/31/2025 |