|
Download Data (XLS File) |
|
||||||||
|
||||||||
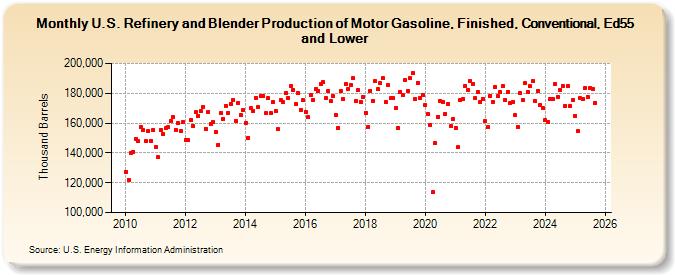
| U.S. Refinery and Blender Production of Motor Gasoline, Finished, Conventional, Ed55 and Lower (Thousand Barrels) | ||||||||
| Year | Jan | Feb | Mar | Apr | May | Jun | Jul | Aug | Sep | Oct | Nov | Dec |
|---|---|---|---|---|---|---|---|---|---|---|---|---|
| 2010 | 127,486 | 122,014 | 139,901 | 140,817 | 149,499 | 148,097 | 157,073 | 155,206 | 147,735 | 154,981 | 148,306 | 155,545 |
| 2011 | 144,116 | 136,972 | 155,367 | 152,552 | 156,507 | 157,341 | 161,749 | 164,088 | 155,600 | 159,866 | 154,806 | 160,427 |
| 2012 | 148,795 | 148,643 | 161,973 | 158,022 | 167,198 | 164,847 | 168,450 | 171,133 | 156,244 | 167,418 | 159,655 | 160,540 |
| 2013 | 153,879 | 145,489 | 166,873 | 163,046 | 171,694 | 166,934 | 173,015 | 175,475 | 161,601 | 173,615 | 165,400 | 168,568 |
| 2014 | 160,041 | 150,274 | 169,870 | 168,255 | 177,149 | 170,802 | 178,157 | 178,328 | 166,489 | 176,691 | 166,763 | 174,247 |
| 2015 | 167,812 | 155,828 | 175,257 | 173,968 | 180,161 | 176,967 | 184,721 | 182,402 | 172,625 | 180,506 | 169,109 | 175,247 |
| 2016 | 167,508 | 164,051 | 178,624 | 175,674 | 182,988 | 181,793 | 186,379 | 187,427 | 176,725 | 181,709 | 174,546 | 178,174 |
| 2017 | 165,298 | 156,593 | 181,535 | 176,093 | 186,122 | 182,976 | 185,682 | 190,066 | 174,815 | 182,299 | 174,411 | 177,846 |
| 2018 | 167,065 | 157,558 | 181,724 | 175,141 | 187,962 | 182,704 | 186,591 | 190,046 | 174,005 | 185,261 | 176,602 | 176,632 |
| 2019 | 170,427 | 156,721 | 181,043 | 178,915 | 188,831 | 181,754 | 190,228 | 193,548 | 176,501 | 187,089 | 177,058 | 178,694 |
| 2020 | 172,054 | 166,044 | 158,796 | 113,598 | 146,576 | 164,289 | 174,502 | 174,284 | 166,318 | 172,749 | 157,729 | 162,566 |
| 2021 | 156,797 | 143,794 | 175,184 | 176,153 | 185,080 | 182,166 | 188,389 | 186,515 | 176,541 | 180,990 | 173,925 | 176,500 |
| 2022 | 161,182 | 157,233 | 178,489 | 174,101 | 184,520 | 177,935 | 180,632 | 184,843 | 175,726 | 180,907 | 173,374 | 174,061 |
| 2023 | 165,120 | 157,264 | 179,805 | 175,213 | 186,475 | 181,077 | 184,552 | 188,304 | 174,659 | 181,640 | 172,189 | 169,760 |
| 2024 | 161,587 | |||||||||||
| - = No Data Reported; -- = Not Applicable; NA = Not Available; W = Withheld to avoid disclosure of individual company data. |
| Release Date: 3/29/2024 |
| Next Release Date: 4/30/2024 |