|
Download Data (XLS File) |
|
||||||||
|
||||||||
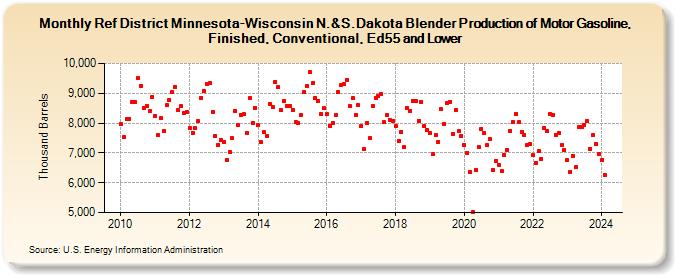
| Ref District Minnesota-Wisconsin N.&S.Dakota Blender Production of Motor Gasoline, Finished, Conventional, Ed55 and Lower (Thousand Barrels) | ||||||||
| Year | Jan | Feb | Mar | Apr | May | Jun | Jul | Aug | Sep | Oct | Nov | Dec |
|---|---|---|---|---|---|---|---|---|---|---|---|---|
| 2010 | 7,962 | 7,524 | 8,130 | 8,152 | 8,716 | 8,705 | 9,520 | 9,253 | 8,517 | 8,568 | 8,400 | 8,876 |
| 2011 | 8,238 | 7,589 | 8,157 | 7,745 | 8,596 | 8,778 | 9,041 | 9,227 | 8,429 | 8,569 | 8,353 | 8,367 |
| 2012 | 7,840 | 7,678 | 7,823 | 8,056 | 8,846 | 9,069 | 9,296 | 9,344 | 8,382 | 7,563 | 7,272 | 7,446 |
| 2013 | 7,352 | 6,773 | 7,036 | 7,487 | 8,398 | 7,928 | 8,282 | 8,289 | 7,656 | 8,834 | 8,003 | 8,521 |
| 2014 | 7,922 | 7,357 | 7,691 | 7,554 | 8,650 | 8,547 | 9,390 | 9,211 | 8,424 | 8,746 | 8,559 | 8,583 |
| 2015 | 8,448 | 8,033 | 7,988 | 8,278 | 9,029 | 9,252 | 9,710 | 9,336 | 8,858 | 8,756 | 8,306 | 8,499 |
| 2016 | 8,293 | 7,918 | 8,011 | 8,260 | 9,034 | 9,291 | 9,313 | 9,454 | 8,571 | 8,831 | 8,285 | 8,597 |
| 2017 | 7,888 | 7,123 | 8,015 | 7,493 | 8,581 | 8,848 | 8,919 | 8,990 | 8,027 | 8,256 | 8,121 | 8,087 |
| 2018 | 7,892 | 7,393 | 7,711 | 7,196 | 8,508 | 8,415 | 8,746 | 8,750 | 8,083 | 8,720 | 7,894 | 7,753 |
| 2019 | 7,676 | 6,951 | 7,598 | 7,372 | 8,460 | 7,967 | 8,691 | 8,723 | 7,650 | 8,439 | 7,739 | 7,584 |
| 2020 | 7,262 | 6,994 | 6,370 | 5,003 | 6,427 | 7,193 | 7,810 | 7,668 | 7,267 | 7,455 | 6,420 | 6,742 |
| 2021 | 6,593 | 6,381 | 6,944 | 7,091 | 7,745 | 8,047 | 8,300 | 8,024 | 7,716 | 7,585 | 7,264 | 7,299 |
| 2022 | 6,921 | 6,670 | 7,050 | 6,803 | 7,852 | 7,733 | 8,289 | 8,282 | 7,616 | 7,660 | 7,261 | 7,084 |
| 2023 | 6,765 | 6,361 | 6,913 | 6,514 | 7,865 | 7,868 | 7,925 | 8,055 | 7,148 | 7,603 | 7,293 | 6,968 |
| 2024 | 6,770 | |||||||||||
| - = No Data Reported; -- = Not Applicable; NA = Not Available; W = Withheld to avoid disclosure of individual company data. |
| Release Date: 3/29/2024 |
| Next Release Date: 4/30/2024 |