|
Download Data (XLS File) |
|
||||||||
|
||||||||
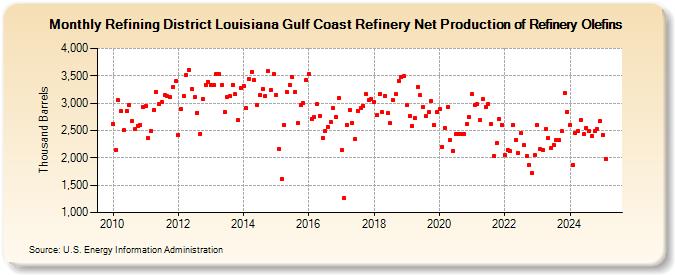
| Refining District Louisiana Gulf Coast Refinery Net Production of Refinery Olefins (Thousand Barrels) | ||||||||
| Year | Jan | Feb | Mar | Apr | May | Jun | Jul | Aug | Sep | Oct | Nov | Dec |
|---|---|---|---|---|---|---|---|---|---|---|---|---|
| 2010 | 2,616 | 2,137 | 3,048 | 2,847 | 2,503 | 2,854 | 2,962 | 2,676 | 2,518 | 2,589 | 2,601 | 2,933 |
| 2011 | 2,941 | 2,356 | 2,492 | 2,878 | 3,200 | 2,981 | 3,014 | 3,144 | 3,121 | 3,109 | 3,294 | 3,396 |
| 2012 | 2,426 | 2,895 | 3,134 | 3,507 | 3,612 | 3,260 | 3,108 | 2,826 | 2,444 | 3,079 | 3,339 | 3,393 |
| 2013 | 3,339 | 3,336 | 3,524 | 3,524 | 3,332 | 2,839 | 3,110 | 3,123 | 3,339 | 3,160 | 2,687 | 3,285 |
| 2014 | 3,320 | 2,903 | 3,442 | 3,574 | 3,421 | 2,965 | 3,143 | 3,258 | 3,133 | 3,578 | 3,233 | 3,540 |
| 2015 | 3,152 | 2,153 | 1,615 | 2,604 | 3,196 | 3,333 | 3,472 | 3,209 | 2,638 | 2,957 | 2,995 | 3,422 |
| 2016 | 3,541 | 2,711 | 2,740 | 2,979 | 2,769 | 2,371 | 2,482 | 2,564 | 2,654 | 2,902 | 2,751 | 3,088 |
| 2017 | 2,140 | 1,258 | 2,609 | 2,879 | 2,636 | 2,348 | 2,862 | 2,915 | 2,952 | 3,161 | 3,052 | 3,077 |
| 2018 | 3,027 | 2,777 | 3,160 | 2,832 | 3,138 | 2,819 | 2,633 | 3,056 | 3,161 | 3,411 | 3,472 | 3,488 |
| 2019 | 2,957 | 2,764 | 2,586 | 2,729 | 3,292 | 3,143 | 2,932 | 2,756 | 2,833 | 3,031 | 2,597 | 2,830 |
| 2020 | 2,884 | 2,205 | 2,550 | 2,925 | 2,319 | 2,132 | 2,427 | 2,436 | 2,436 | 2,440 | 2,614 | 2,742 |
| 2021 | 3,159 | 2,971 | 2,976 | 2,691 | 3,068 | 2,922 | 2,985 | 2,624 | 2,031 | 2,271 | 2,709 | 2,605 |
| 2022 | 2,050 | 2,152 | 2,116 | 2,593 | 2,327 | 2,091 | 2,448 | 2,229 | 2,035 | 1,864 | 1,720 | 2,049 |
| 2023 | 2,591 | 2,161 | 2,140 | 2,523 | 2,357 | 2,174 | 2,235 | 2,326 | 2,320 | 2,482 | 3,181 | 2,843 |
| 2024 | 2,605 | |||||||||||
| - = No Data Reported; -- = Not Applicable; NA = Not Available; W = Withheld to avoid disclosure of individual company data. |
| Release Date: 3/29/2024 |
| Next Release Date: 4/30/2024 |