|
Download Data (XLS File) |
|
||||||||
|
||||||||
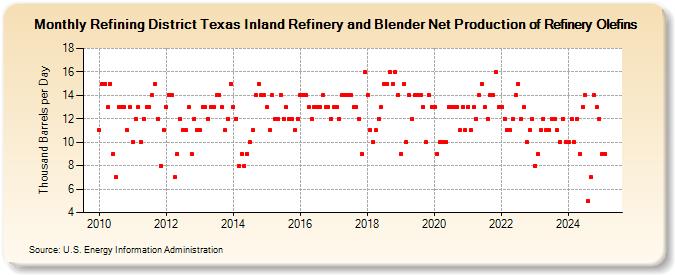
| Refining District Texas Inland Refinery and Blender Net Production of Refinery Olefins (Thousand Barrels per Day) | ||||||||
| Year | Jan | Feb | Mar | Apr | May | Jun | Jul | Aug | Sep | Oct | Nov | Dec |
|---|---|---|---|---|---|---|---|---|---|---|---|---|
| 2010 | 11 | 15 | 15 | 13 | 15 | 9 | 7 | 13 | 13 | 13 | 11 | 13 |
| 2011 | 10 | 12 | 13 | 10 | 12 | 13 | 13 | 14 | 15 | 12 | 8 | 11 |
| 2012 | 13 | 14 | 14 | 7 | 9 | 12 | 11 | 11 | 13 | 9 | 12 | 11 |
| 2013 | 11 | 13 | 13 | 12 | 13 | 13 | 14 | 14 | 13 | 11 | 12 | 15 |
| 2014 | 13 | 12 | 8 | 9 | 8 | 9 | 10 | 11 | 14 | 15 | 14 | 14 |
| 2015 | 13 | 11 | 14 | 12 | 12 | 14 | 12 | 13 | 12 | 12 | 11 | 12 |
| 2016 | 14 | 14 | 14 | 13 | 12 | 13 | 13 | 13 | 14 | 13 | 13 | 12 |
| 2017 | 13 | 13 | 12 | 14 | 14 | 14 | 14 | 13 | 13 | 12 | 9 | 16 |
| 2018 | 14 | 11 | 10 | 11 | 12 | 13 | 15 | 15 | 16 | 15 | 16 | 14 |
| 2019 | 9 | 15 | 10 | 14 | 12 | 14 | 14 | 14 | 13 | 10 | 14 | 13 |
| 2020 | 13 | 9 | 10 | 10 | 10 | 13 | 13 | 13 | 13 | 11 | 13 | 11 |
| 2021 | 13 | 11 | 13 | 12 | 14 | 15 | 13 | 12 | 14 | 14 | 16 | 13 |
| 2022 | 13 | 12 | 11 | 11 | 12 | 14 | 15 | 12 | 13 | 10 | 11 | 12 |
| 2023 | 8 | 9 | 11 | 12 | 11 | 11 | 12 | 12 | 11 | 10 | 12 | 10 |
| 2024 | 10 | 12 | 10 | 12 | 9 | 13 | 14 | 5 | 7 | 14 | 13 | 12 |
| 2025 | 9 | 9 | 14 | 9 | ||||||||
| - = No Data Reported; -- = Not Applicable; NA = Not Available; W = Withheld to avoid disclosure of individual company data. |
| Release Date: 6/30/2025 |
| Next Release Date: 7/31/2025 |