|
Download Data (XLS File) |
|
||||||||
|
||||||||
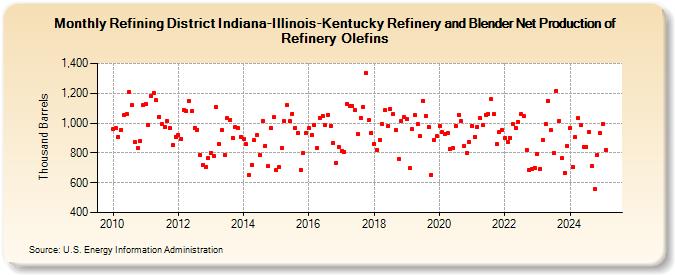
| Refining District Indiana-Illinois-Kentucky Refinery and Blender Net Production of Refinery Olefins (Thousand Barrels) | ||||||||
| Year | Jan | Feb | Mar | Apr | May | Jun | Jul | Aug | Sep | Oct | Nov | Dec |
|---|---|---|---|---|---|---|---|---|---|---|---|---|
| 2010 | 958 | 966 | 909 | 955 | 1,056 | 1,060 | 1,209 | 1,121 | 873 | 831 | 877 | 1,119 |
| 2011 | 1,128 | 987 | 1,180 | 1,203 | 1,152 | 1,043 | 991 | 974 | 1,013 | 964 | 850 | 909 |
| 2012 | 921 | 894 | 1,091 | 1,079 | 1,149 | 1,081 | 969 | 957 | 789 | 722 | 703 | 769 |
| 2013 | 802 | 782 | 1,105 | 863 | 955 | 786 | 1,031 | 1,024 | 902 | 973 | 965 | 910 |
| 2014 | 894 | 857 | 654 | 721 | 885 | 917 | 787 | 1,016 | 849 | 710 | 965 | 1,038 |
| 2015 | 684 | 705 | 835 | 1,014 | 1,119 | 1,011 | 1,064 | 969 | 937 | 688 | 800 | 937 |
| 2016 | 965 | 920 | 989 | 835 | 1,037 | 1,050 | 986 | 1,055 | 983 | 869 | 734 | 843 |
| 2017 | 814 | 809 | 1,131 | 1,118 | 1,117 | 1,086 | 928 | 1,037 | 1,110 | 1,335 | 1,022 | 937 |
| 2018 | 860 | 819 | 886 | 995 | 1,086 | 983 | 1,093 | 1,060 | 957 | 758 | 1,015 | 1,038 |
| 2019 | 1,027 | 698 | 959 | 1,052 | 991 | 911 | 1,149 | 1,051 | 975 | 654 | 886 | 911 |
| 2020 | 983 | 939 | 927 | 935 | 827 | 830 | 982 | 1,057 | 1,015 | 847 | 802 | 873 |
| 2021 | 980 | 906 | 975 | 1,033 | 986 | 1,056 | 1,063 | 1,160 | 1,060 | 859 | 942 | 955 |
| 2022 | 898 | 876 | 902 | 995 | 970 | 1,010 | 1,058 | 1,046 | 821 | 687 | 695 | 702 |
| 2023 | 791 | 691 | 886 | 991 | 1,151 | 951 | 801 | 1,218 | 1,017 | 764 | 668 | 848 |
| 2024 | 965 | |||||||||||
| - = No Data Reported; -- = Not Applicable; NA = Not Available; W = Withheld to avoid disclosure of individual company data. |
| Release Date: 3/29/2024 |
| Next Release Date: 4/30/2024 |