|
Download Data (XLS File) |
|
||||||||
|
||||||||
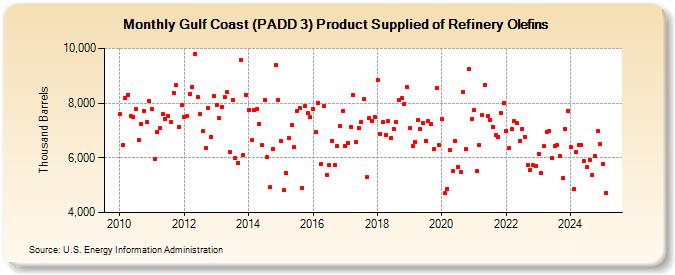
| Gulf Coast (PADD 3) Product Supplied of Refinery Olefins (Thousand Barrels) | ||||||||
| Year | Jan | Feb | Mar | Apr | May | Jun | Jul | Aug | Sep | Oct | Nov | Dec |
|---|---|---|---|---|---|---|---|---|---|---|---|---|
| 2010 | 7,593 | 6,459 | 8,182 | 8,312 | 7,524 | 7,506 | 7,798 | 6,651 | 7,244 | 7,711 | 7,318 | 8,063 |
| 2011 | 7,775 | 5,963 | 6,939 | 7,074 | 7,600 | 7,420 | 7,515 | 7,317 | 8,371 | 8,646 | 7,138 | 7,919 |
| 2012 | 7,489 | 7,529 | 8,315 | 8,589 | 9,782 | 8,236 | 7,605 | 6,977 | 6,347 | 7,808 | 6,777 | 8,275 |
| 2013 | 7,917 | 7,438 | 7,869 | 8,211 | 8,391 | 6,213 | 8,124 | 6,007 | 5,829 | 9,592 | 6,100 | 8,311 |
| 2014 | 7,762 | 6,655 | 7,747 | 7,773 | 7,238 | 6,469 | 8,115 | 6,020 | 4,921 | 6,307 | 9,398 | 8,115 |
| 2015 | 6,622 | 4,841 | 5,464 | 6,710 | 7,217 | 6,382 | 7,712 | 7,822 | 4,904 | 7,890 | 7,625 | 7,483 |
| 2016 | 7,771 | 6,938 | 8,014 | 5,788 | 7,877 | 5,374 | 5,721 | 6,630 | 5,753 | 6,415 | 7,172 | 7,730 |
| 2017 | 6,429 | 6,542 | 7,143 | 8,300 | 6,588 | 7,102 | 7,304 | 8,159 | 5,290 | 7,457 | 7,356 | 7,481 |
| 2018 | 8,831 | 6,873 | 7,299 | 6,844 | 7,331 | 6,718 | 7,056 | 7,304 | 8,098 | 8,174 | 7,983 | 8,584 |
| 2019 | 7,078 | 6,418 | 6,590 | 7,388 | 7,050 | 7,286 | 6,620 | 7,335 | 7,229 | 6,310 | 8,545 | 6,483 |
| 2020 | 7,405 | 4,697 | 4,877 | 6,294 | 5,504 | 6,608 | 5,672 | 5,480 | 8,403 | 6,306 | 9,263 | 7,403 |
| 2021 | 7,743 | 5,513 | 6,468 | 7,560 | 8,678 | 7,533 | 7,381 | 7,131 | 6,827 | 6,778 | 7,648 | 8,020 |
| 2022 | 6,999 | 6,367 | 7,052 | 7,355 | 7,255 | 6,623 | 7,070 | 6,762 | 5,723 | 5,549 | 5,728 | 5,717 |
| 2023 | 6,148 | 5,443 | 6,424 | 6,957 | 6,996 | 5,990 | 6,438 | 6,467 | 6,063 | 5,257 | 7,068 | 7,711 |
| 2024 | 6,379 | 4,859 | 6,220 | 6,452 | 6,473 | 5,875 | 5,663 | 5,934 | 5,380 | 6,074 | 6,974 | 6,498 |
| 2025 | 5,767 | 4,727 | 4,739 | 5,208 | ||||||||
| - = No Data Reported; -- = Not Applicable; NA = Not Available; W = Withheld to avoid disclosure of individual company data. |
| Release Date: 6/30/2025 |
| Next Release Date: 7/31/2025 |