|
Download Data (XLS File) |
|
||||||||
|
||||||||
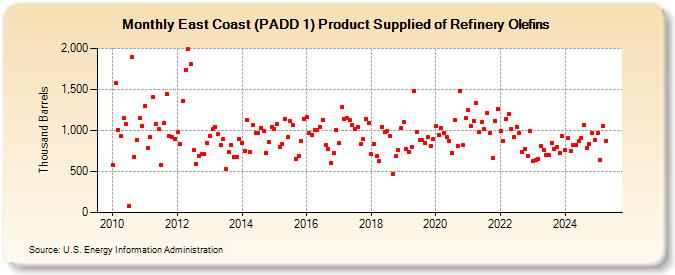
| East Coast (PADD 1) Product Supplied of Refinery Olefins (Thousand Barrels) | ||||||||
| Year | Jan | Feb | Mar | Apr | May | Jun | Jul | Aug | Sep | Oct | Nov | Dec |
|---|---|---|---|---|---|---|---|---|---|---|---|---|
| 2010 | 574 | 1,576 | 1,006 | 932 | 1,146 | 1,076 | 76 | 1,892 | 677 | 883 | 1,157 | 1,049 |
| 2011 | 1,296 | 791 | 920 | 1,406 | 1,073 | 1,024 | 578 | 1,085 | 1,442 | 927 | 921 | 902 |
| 2012 | 985 | 830 | 1,353 | 1,740 | 1,989 | 1,809 | 758 | 590 | 693 | 714 | 711 | 842 |
| 2013 | 933 | 1,016 | 1,040 | 952 | 822 | 894 | 527 | 734 | 820 | 681 | 674 | 902 |
| 2014 | 850 | 751 | 1,128 | 738 | 1,064 | 975 | 970 | 1,035 | 997 | 729 | 865 | 1,037 |
| 2015 | 1,024 | 1,083 | 801 | 833 | 1,137 | 920 | 1,114 | 1,069 | 651 | 689 | 868 | 1,145 |
| 2016 | 1,164 | 970 | 949 | 1,010 | 1,009 | 1,044 | 1,125 | 824 | 774 | 606 | 728 | 1,008 |
| 2017 | 851 | 1,289 | 1,144 | 1,147 | 1,127 | 1,065 | 1,013 | 1,046 | 833 | 894 | 1,138 | 1,085 |
| 2018 | 714 | 835 | 689 | 626 | 1,045 | 983 | 991 | 931 | 473 | 686 | 765 | 1,028 |
| 2019 | 1,105 | 779 | 734 | 798 | 1,483 | 979 | 878 | 881 | 849 | 916 | 812 | 895 |
| 2020 | 1,051 | 941 | 1,025 | 975 | 915 | 871 | 731 | 1,122 | 816 | 1,478 | 823 | 1,155 |
| 2021 | 1,251 | 1,053 | 1,121 | 1,340 | 983 | 1,098 | 1,020 | 1,217 | 966 | 663 | 1,119 | 1,259 |
| 2022 | 999 | 866 | 1,145 | 1,204 | 1,023 | 917 | 1,044 | 973 | 738 | 775 | 695 | 998 |
| 2023 | 627 | 643 | 648 | 812 | 767 | 708 | 700 | 849 | 778 | 793 | 722 | 933 |
| 2024 | 759 | 905 | 749 | 826 | ||||||||
| - = No Data Reported; -- = Not Applicable; NA = Not Available; W = Withheld to avoid disclosure of individual company data. |
| Release Date: 6/28/2024 |
| Next Release Date: 7/31/2024 |